Fig. 1
Download original image
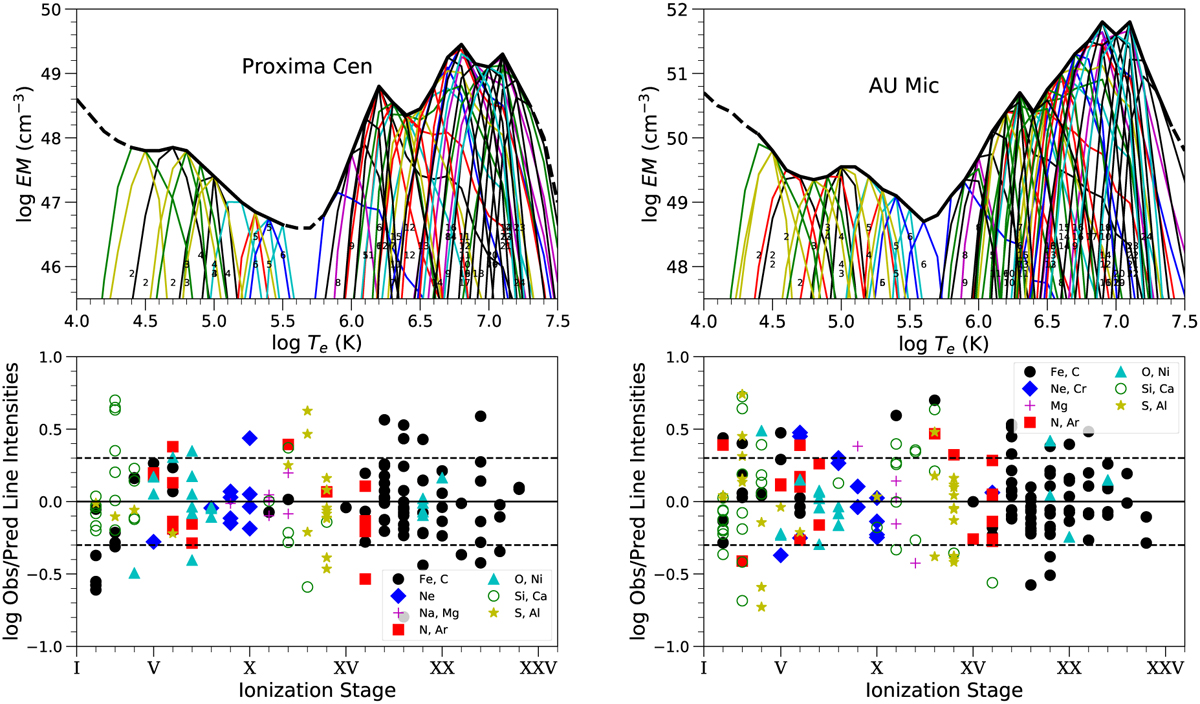
Coronal models of Proxima Cen (left) and AU Mic (right), combining data from XMM-Newton, EUVE, HST/STIS, and FUSE. Upper panels: emission measure distributions (EMDs, thick line). The thin lines represent the contribution function for each ion (the emissivity function multiplied by the EMD at each point). The small numbers indicate the ionization stages of the species. Lower panels: observed-to-predicted line flux ratios for the ion stages in the upper panels. The dashed lines denote a factor of 2.
Current usage metrics show cumulative count of Article Views (full-text article views including HTML views, PDF and ePub downloads, according to the available data) and Abstracts Views on Vision4Press platform.
Data correspond to usage on the plateform after 2015. The current usage metrics is available 48-96 hours after online publication and is updated daily on week days.
Initial download of the metrics may take a while.