Fig. 9
Download original image
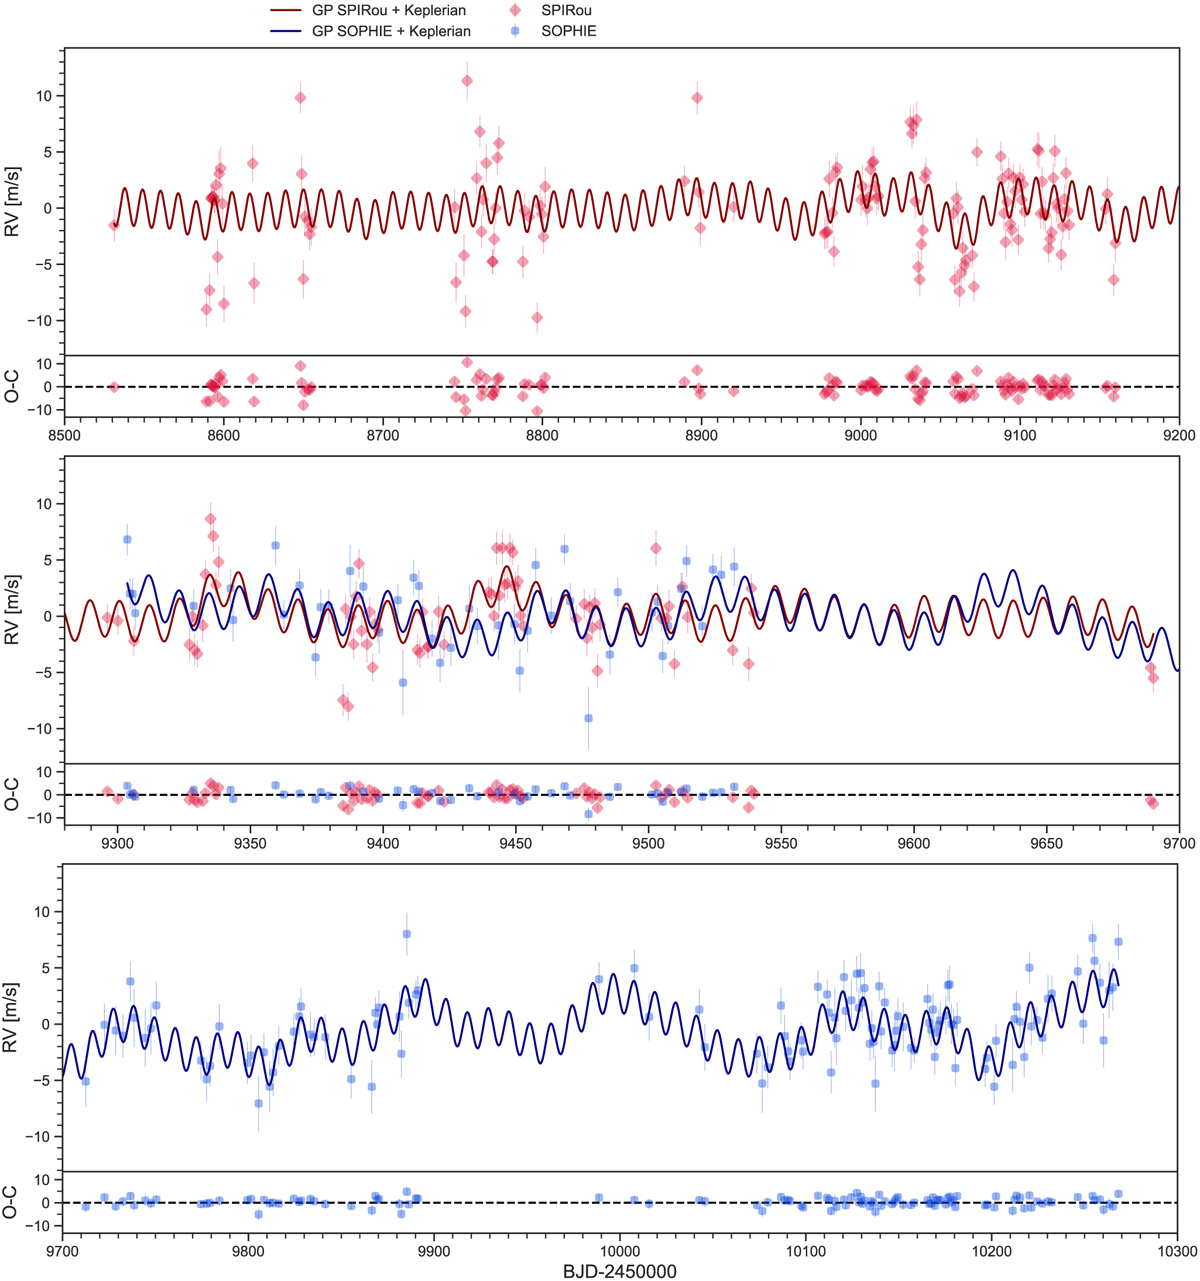
RVs time series of SOPHIE in blue circles, and SPIRou in red squares. The best-fit model including the Keplerian signal and the GP for each instrument are depicted as a dark blue line for SOPHIE and dark red line for SPIRou. The panels represent three consecutive observing seasons, with their respective residuals shown underneath. The residuals of the final model yield RMS are 2.0 m/s for SOPHIE and 3.2m/s for SPIRou.
Current usage metrics show cumulative count of Article Views (full-text article views including HTML views, PDF and ePub downloads, according to the available data) and Abstracts Views on Vision4Press platform.
Data correspond to usage on the plateform after 2015. The current usage metrics is available 48-96 hours after online publication and is updated daily on week days.
Initial download of the metrics may take a while.