Fig. 8
Download original image
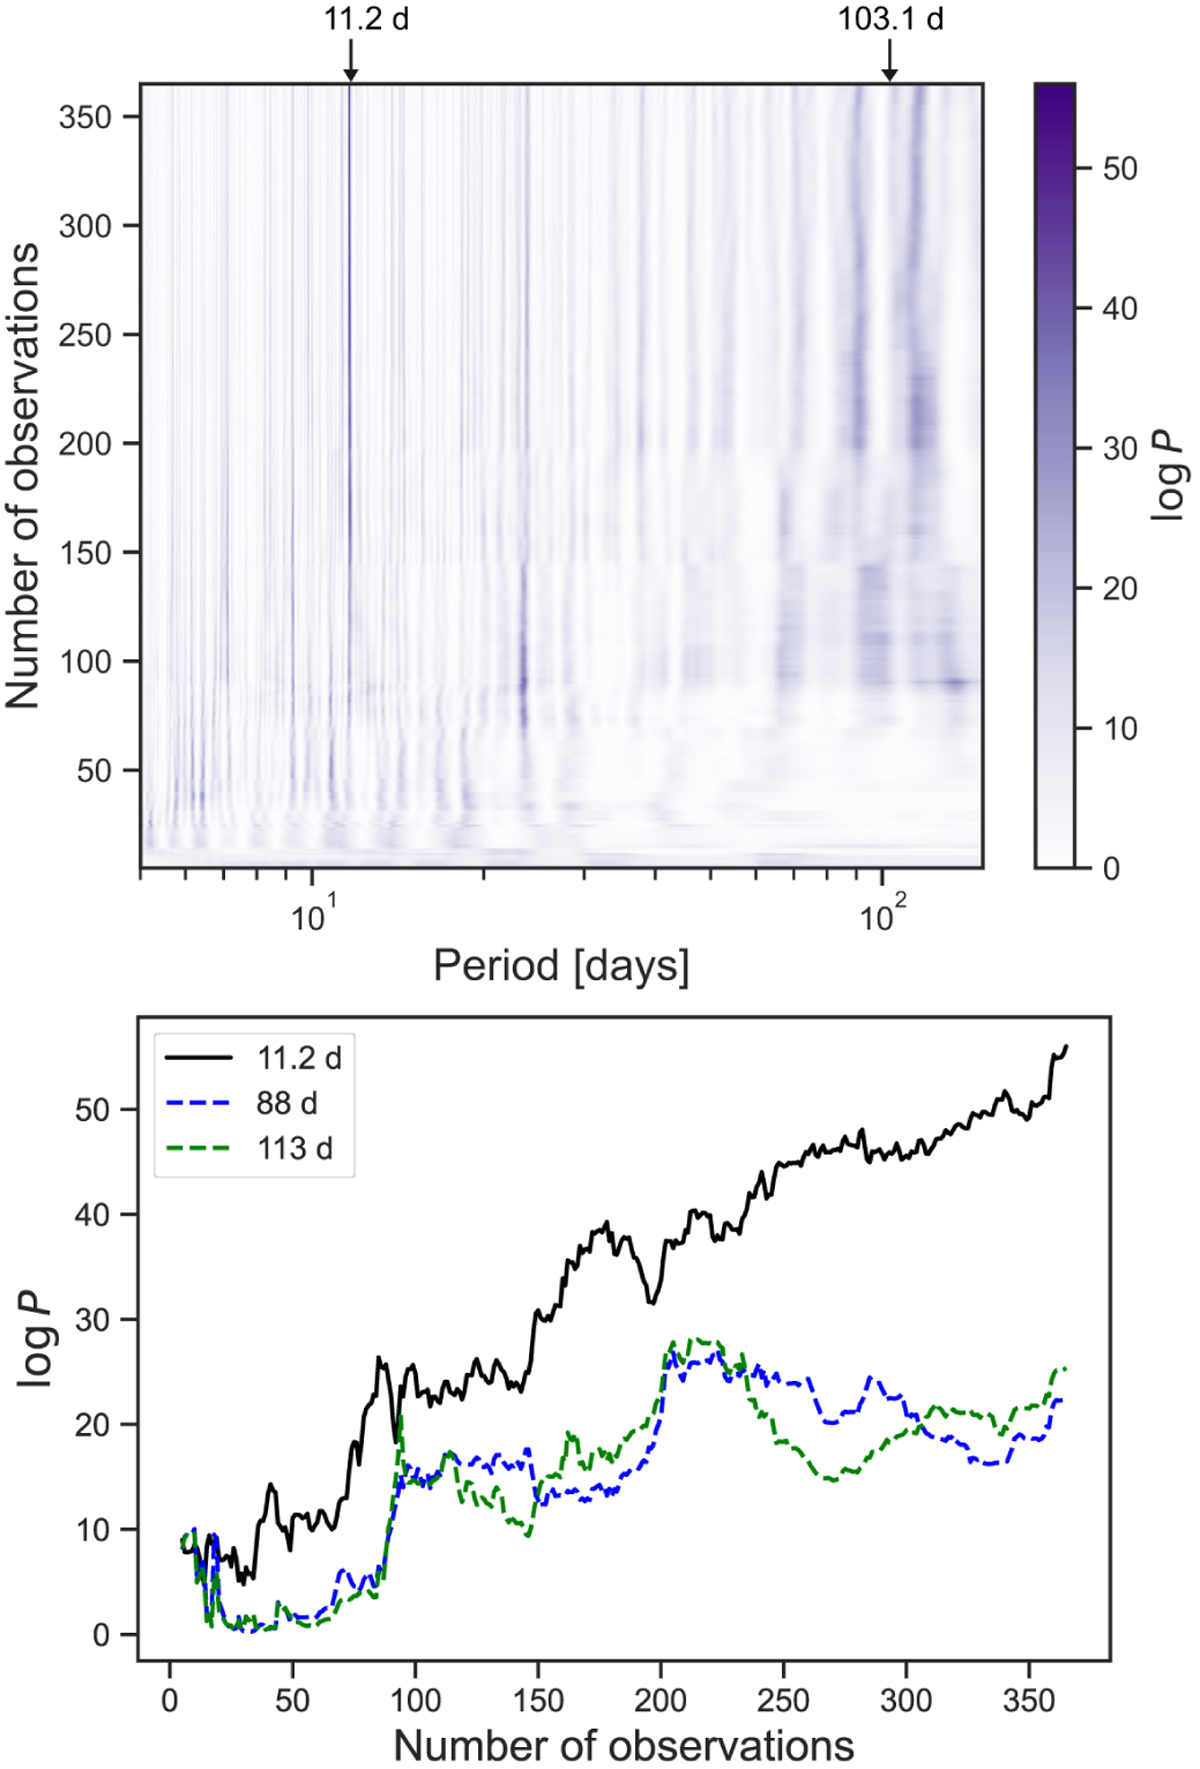
Results of the BGLS periodogram analysis. Top: stacked BGLS periodograms of the complete RV dataset. The colour bar indicates the log-likelihood (log P) level. The black arrows mark the planetary signal at 11.2 days and the stellar rotation period at 103.1 days. Bottom: evolution of the log-likelihood a function of the number of observations for the three most significant signals in the BLS periodogram: 11.2, 88, and 113 days.
Current usage metrics show cumulative count of Article Views (full-text article views including HTML views, PDF and ePub downloads, according to the available data) and Abstracts Views on Vision4Press platform.
Data correspond to usage on the plateform after 2015. The current usage metrics is available 48-96 hours after online publication and is updated daily on week days.
Initial download of the metrics may take a while.