Fig. 7
Download original image
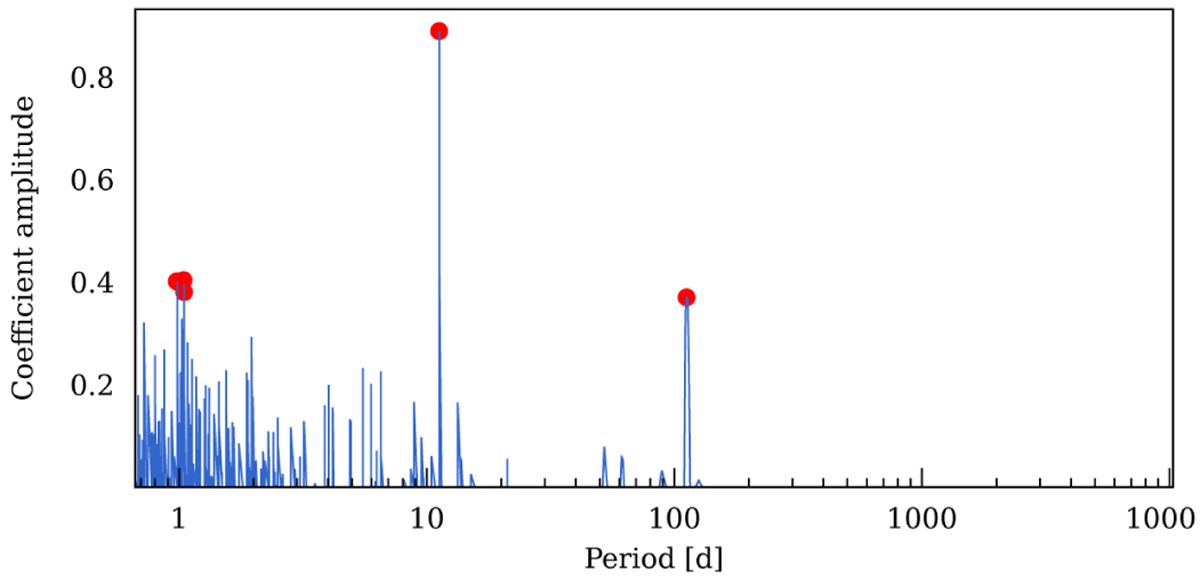
l1 periodogram of the SOPHIE and SPIRou RVs. The five most significant periods are highlighted with a red circle. The signal with the highest amplitude is located at 11.2 days with a log10(FAP) = −5.9. Around 1 day we see three peaks which origin is the data sampling. The longest significant periodicity is located at 113 days.
Current usage metrics show cumulative count of Article Views (full-text article views including HTML views, PDF and ePub downloads, according to the available data) and Abstracts Views on Vision4Press platform.
Data correspond to usage on the plateform after 2015. The current usage metrics is available 48-96 hours after online publication and is updated daily on week days.
Initial download of the metrics may take a while.