Fig. 15
Download original image
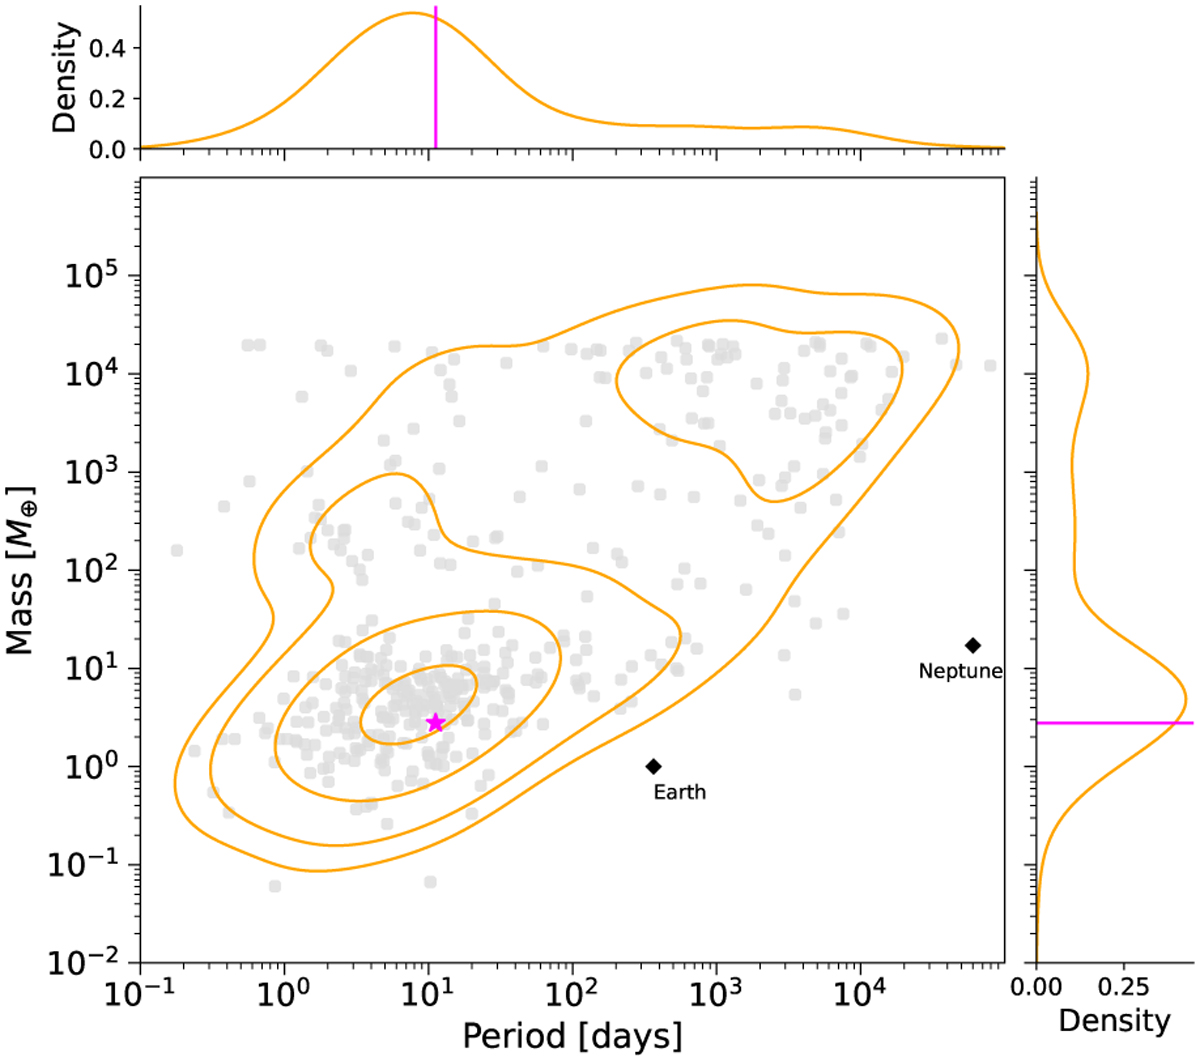
Orbital period versus mass diagram of planets around M dwarfs. For simplicity, planets with orbits larger than 105 days are not included. The orange contours indicate 10, 30, 60, and 90% of density levels of the observed probability density of the joint mass and period distribution. The magenta star and lines indicate the position of G1725A b, with a minimum mass of Mp sin= 2.78 ± 0.35 M⊕, and an orbital period of 11.2 days. The top and right histograms correspond to the probability density distribution of the orbital periods and planetary masses, respectively. For reference, the black diamonds represent the Earth and Neptune.
Current usage metrics show cumulative count of Article Views (full-text article views including HTML views, PDF and ePub downloads, according to the available data) and Abstracts Views on Vision4Press platform.
Data correspond to usage on the plateform after 2015. The current usage metrics is available 48-96 hours after online publication and is updated daily on week days.
Initial download of the metrics may take a while.