Fig. 4.
Download original image
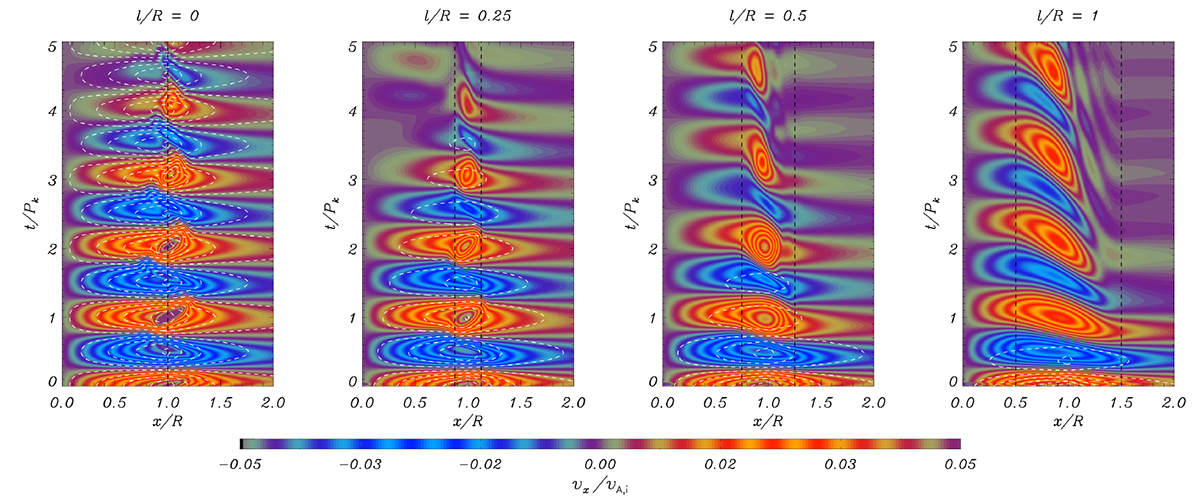
Time–distance diagrams of the x component of velocity at y = z = 0 and x ∈ [0, 2R] for the simulations of the m = 2 mode with v0/vA, i = 0.05 and ρi/ρe = 5. From left to right, the four panels correspond to the results with l/R = 0, 0.25, 0.5, and 1, respectively. The vertical dashed black lines denote the boundaries of the nonuniform region. The dashed white contours represent the expected behavior of the quasi-mode in each case.
Current usage metrics show cumulative count of Article Views (full-text article views including HTML views, PDF and ePub downloads, according to the available data) and Abstracts Views on Vision4Press platform.
Data correspond to usage on the plateform after 2015. The current usage metrics is available 48-96 hours after online publication and is updated daily on week days.
Initial download of the metrics may take a while.