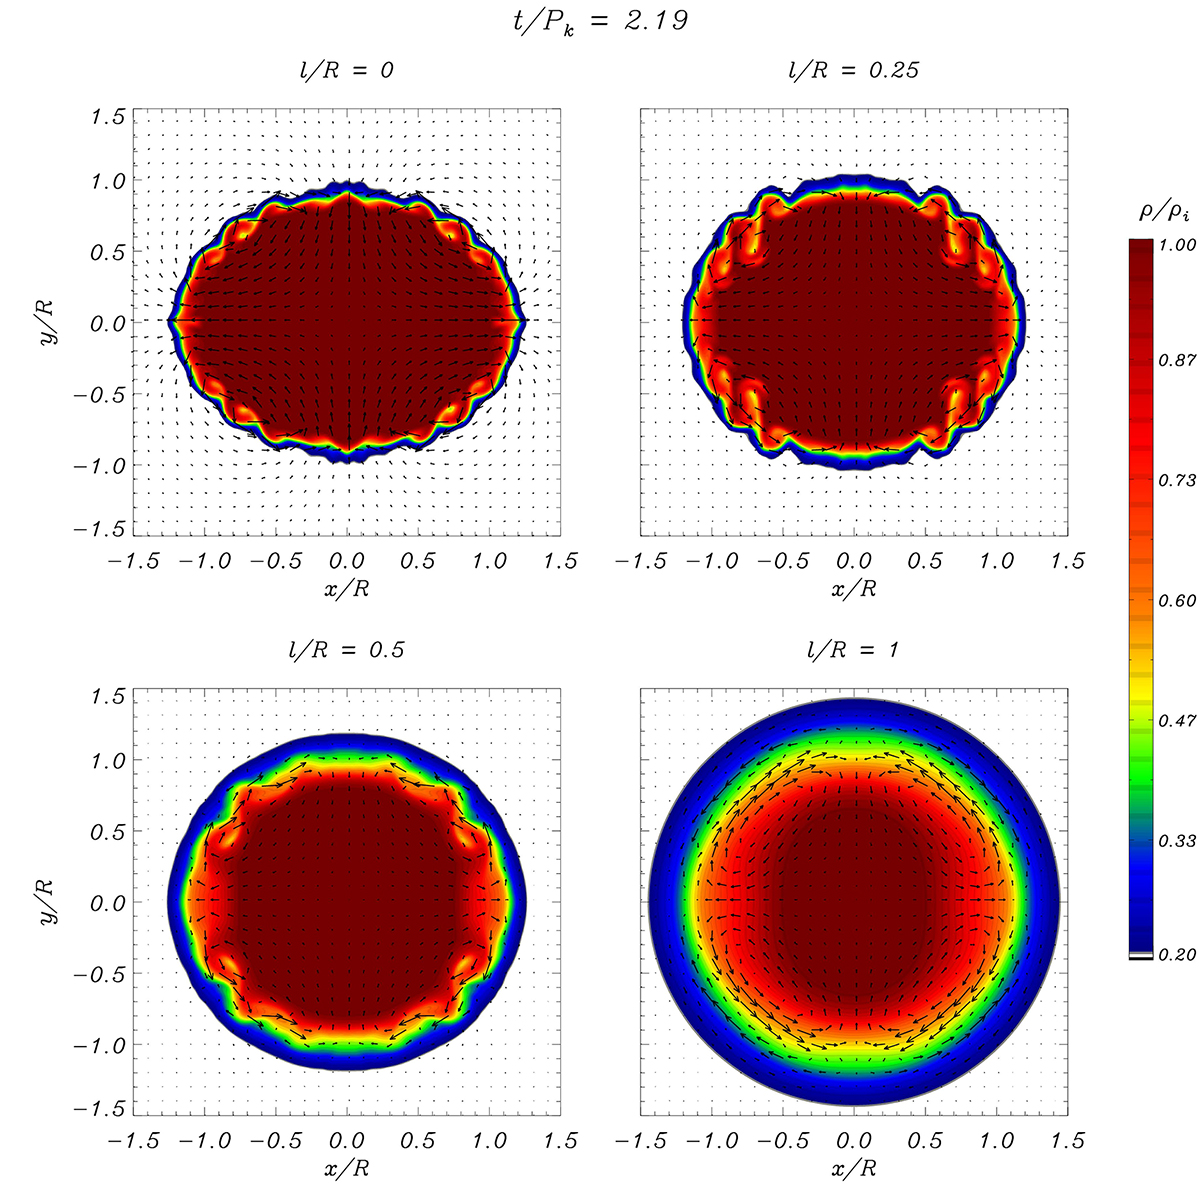
Fig. 3.
Download original image
Simulations of the m = 2 mode with v0/vA, i = 0.05 and ρi/ρe = 5. Cross-sectional cuts of the density at the tube center, z = 0, for the cases with l/R = 0 (top left), l/R = 0.25 (top right), l/R = 0.5 (bottom left), and l/R = 1 (bottom right). Only a subregion of the complete numerical domain in the vicinity of the flux tube is shown. A snapshot of the evolution at t/Pk = 2.19 is displayed in the still image. The complete temporal evolution is available in the accompanying movie.
Current usage metrics show cumulative count of Article Views (full-text article views including HTML views, PDF and ePub downloads, according to the available data) and Abstracts Views on Vision4Press platform.
Data correspond to usage on the plateform after 2015. The current usage metrics is available 48-96 hours after online publication and is updated daily on week days.
Initial download of the metrics may take a while.