Fig. 8
Download original image
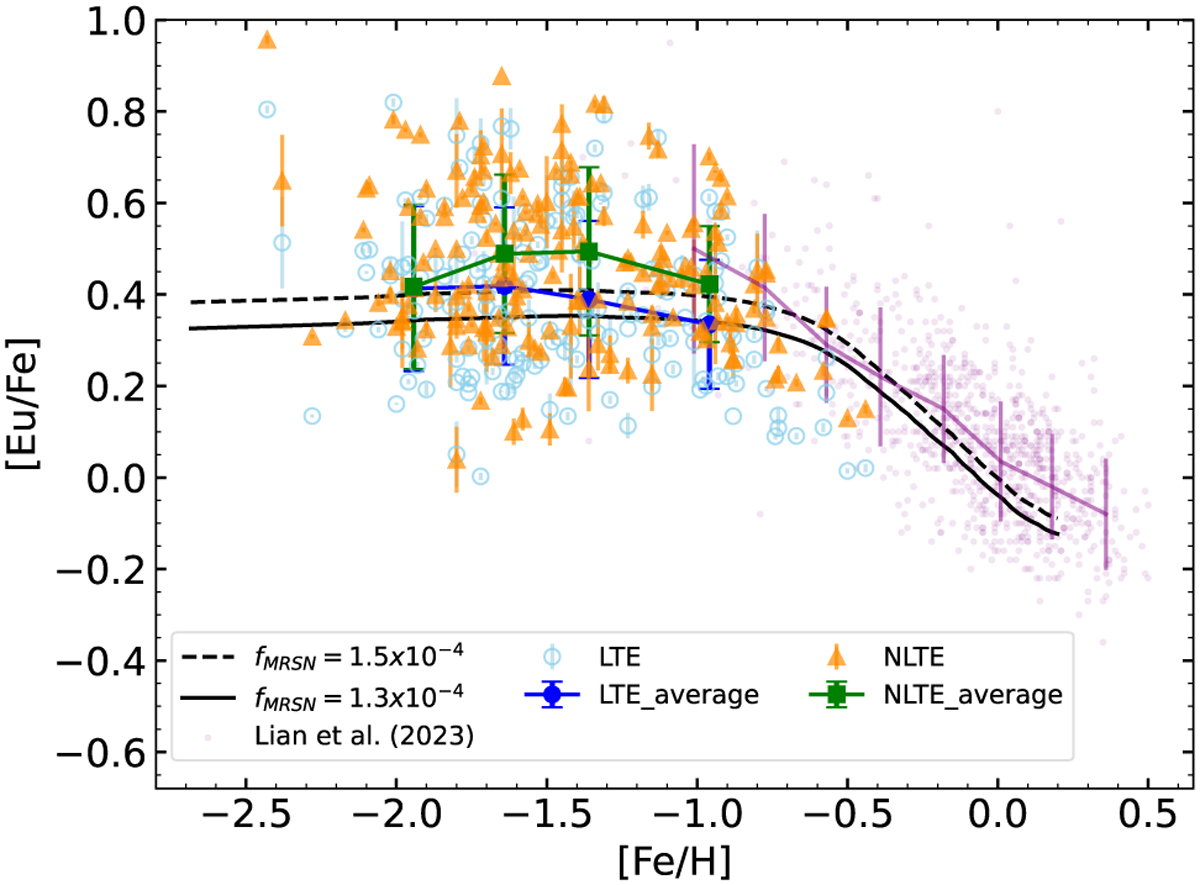
Trend of [Eu/Fe] based on the best-fit results of 1D NLTE and LTE. The green squares and blue dots represent the averaged NLTE and LTE [Eu/Fe] ratios across the selected bins. The yellow triangles and cyan circles represent the NLTE and LTE [Eu/Fe] for each stars. The purple dots represent 1D LTE Eu abundance measurements of 1274 metal-rich stars from Gaia-ESO survey. The dashed and solid lines represent the GCE models with different fraction of massive stars that end up with MRSN instead of CCSN.
Current usage metrics show cumulative count of Article Views (full-text article views including HTML views, PDF and ePub downloads, according to the available data) and Abstracts Views on Vision4Press platform.
Data correspond to usage on the plateform after 2015. The current usage metrics is available 48-96 hours after online publication and is updated daily on week days.
Initial download of the metrics may take a while.