Fig. 2
Download original image
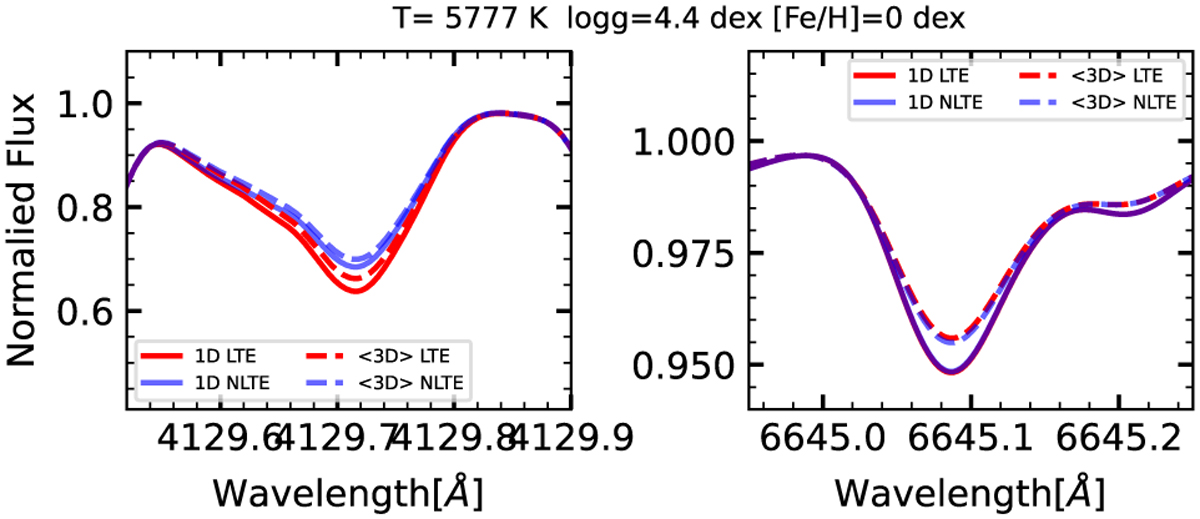
Synthetic spectra for Eu II 4129 Å (left) and Eu II 6645 Å (right) generated from TSFitPy base on solar parameter with A(Eu)=0.57 dex. The red solid lines represent the line profile generated from 1D LTE and the blue solid lines are from 1D NLTE, while the red dash lines represent the line profile generated from <3D> LTE and the blue dash lines are from <3D> NLTE.
Current usage metrics show cumulative count of Article Views (full-text article views including HTML views, PDF and ePub downloads, according to the available data) and Abstracts Views on Vision4Press platform.
Data correspond to usage on the plateform after 2015. The current usage metrics is available 48-96 hours after online publication and is updated daily on week days.
Initial download of the metrics may take a while.