Fig. 5
Download original image
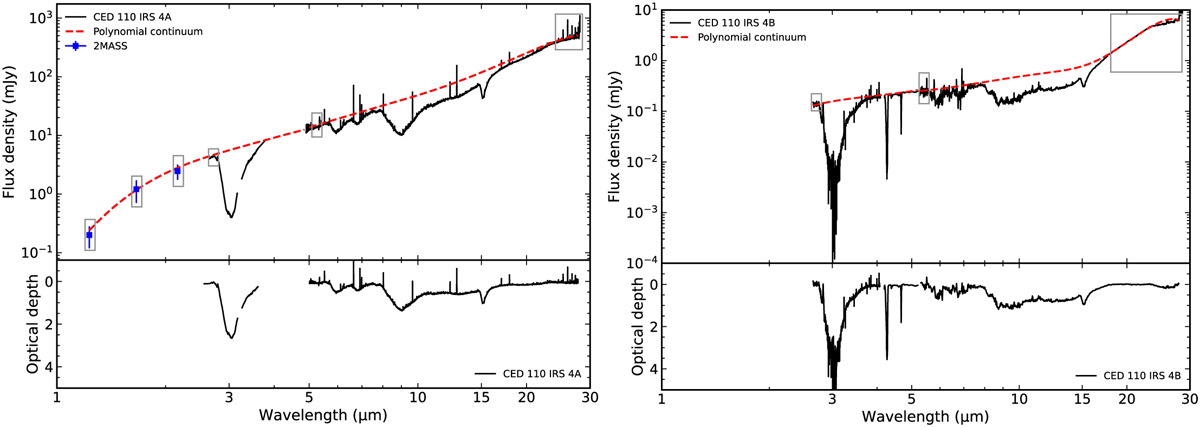
Dust continuum profiles (top panels) and optical depth spectra (bottom panels) of Ced 110 IRS4A (left) and IRS4B (right). For IRS4A source, 2MASS data are used to trace the continuum below 2.5 µm. The red dashed line shows the continuum profile traced by a polynomial function and the grey boxes indicate the spectral regions used as anchor to guide the fit. The polynomials for IRS4A are 3rd order for NIRSpec and MIRI respectively. Similarly, for IRS4B, they are 2nd and 5th orders, respectively. The strong upward inflexion in the IRS4B source longwards of 15 µm is due to the PSF overlap in the MIRI range with the IRS4A source (see Figure 3).
Current usage metrics show cumulative count of Article Views (full-text article views including HTML views, PDF and ePub downloads, according to the available data) and Abstracts Views on Vision4Press platform.
Data correspond to usage on the plateform after 2015. The current usage metrics is available 48-96 hours after online publication and is updated daily on week days.
Initial download of the metrics may take a while.