Fig. 12
Download original image
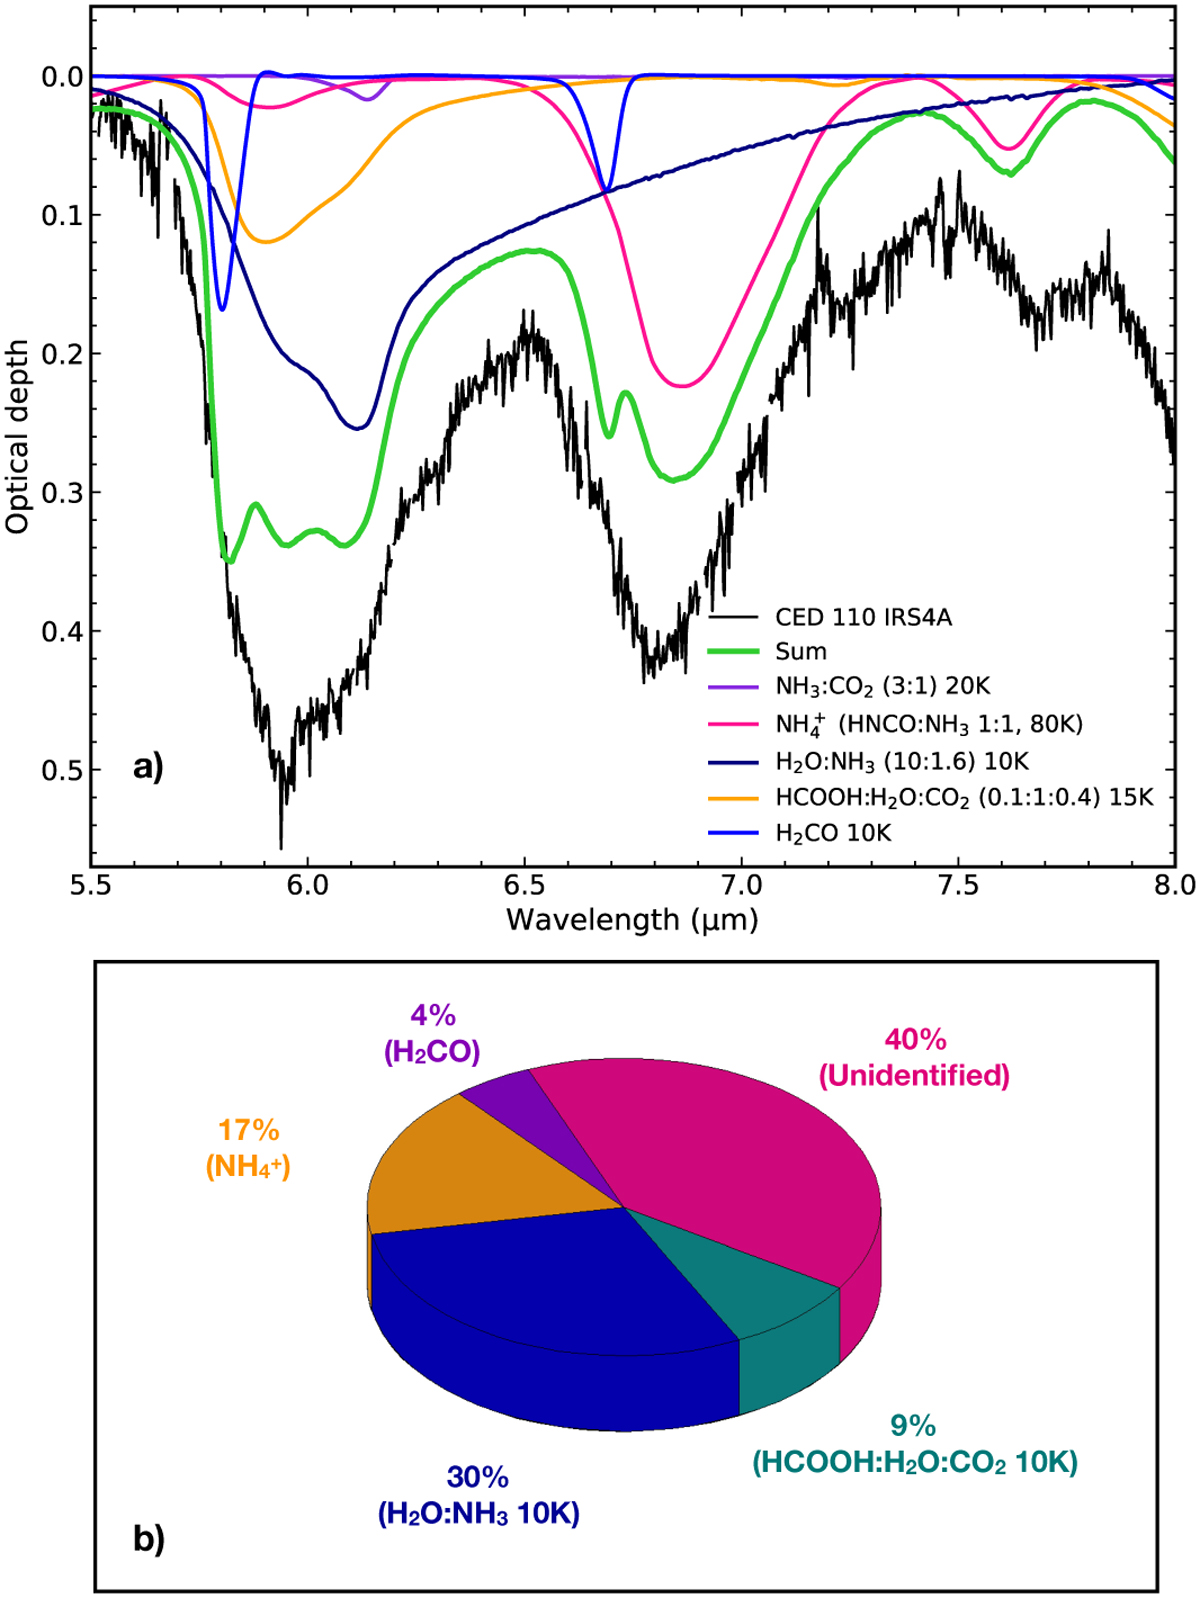
Simplified analysis of the 6 and 6.8 µm bands of Ced 110 IRS4A using laboratory data. H2O ice is not subtracted in this case. Panel a shows the sum (green) of four laboratory spectra of known species. Panel b shows the fractional area of each component relative to the total area in the MIRI spectra between 5.5 and 7.5 µm. Unidentified refers to the difference between the MIRI data and the sum of the four components in the specified range. The contribution of NH3:CO2 is not added to the chart because it represents less than 1% of the total area.
Current usage metrics show cumulative count of Article Views (full-text article views including HTML views, PDF and ePub downloads, according to the available data) and Abstracts Views on Vision4Press platform.
Data correspond to usage on the plateform after 2015. The current usage metrics is available 48-96 hours after online publication and is updated daily on week days.
Initial download of the metrics may take a while.