Fig. 10
Download original image
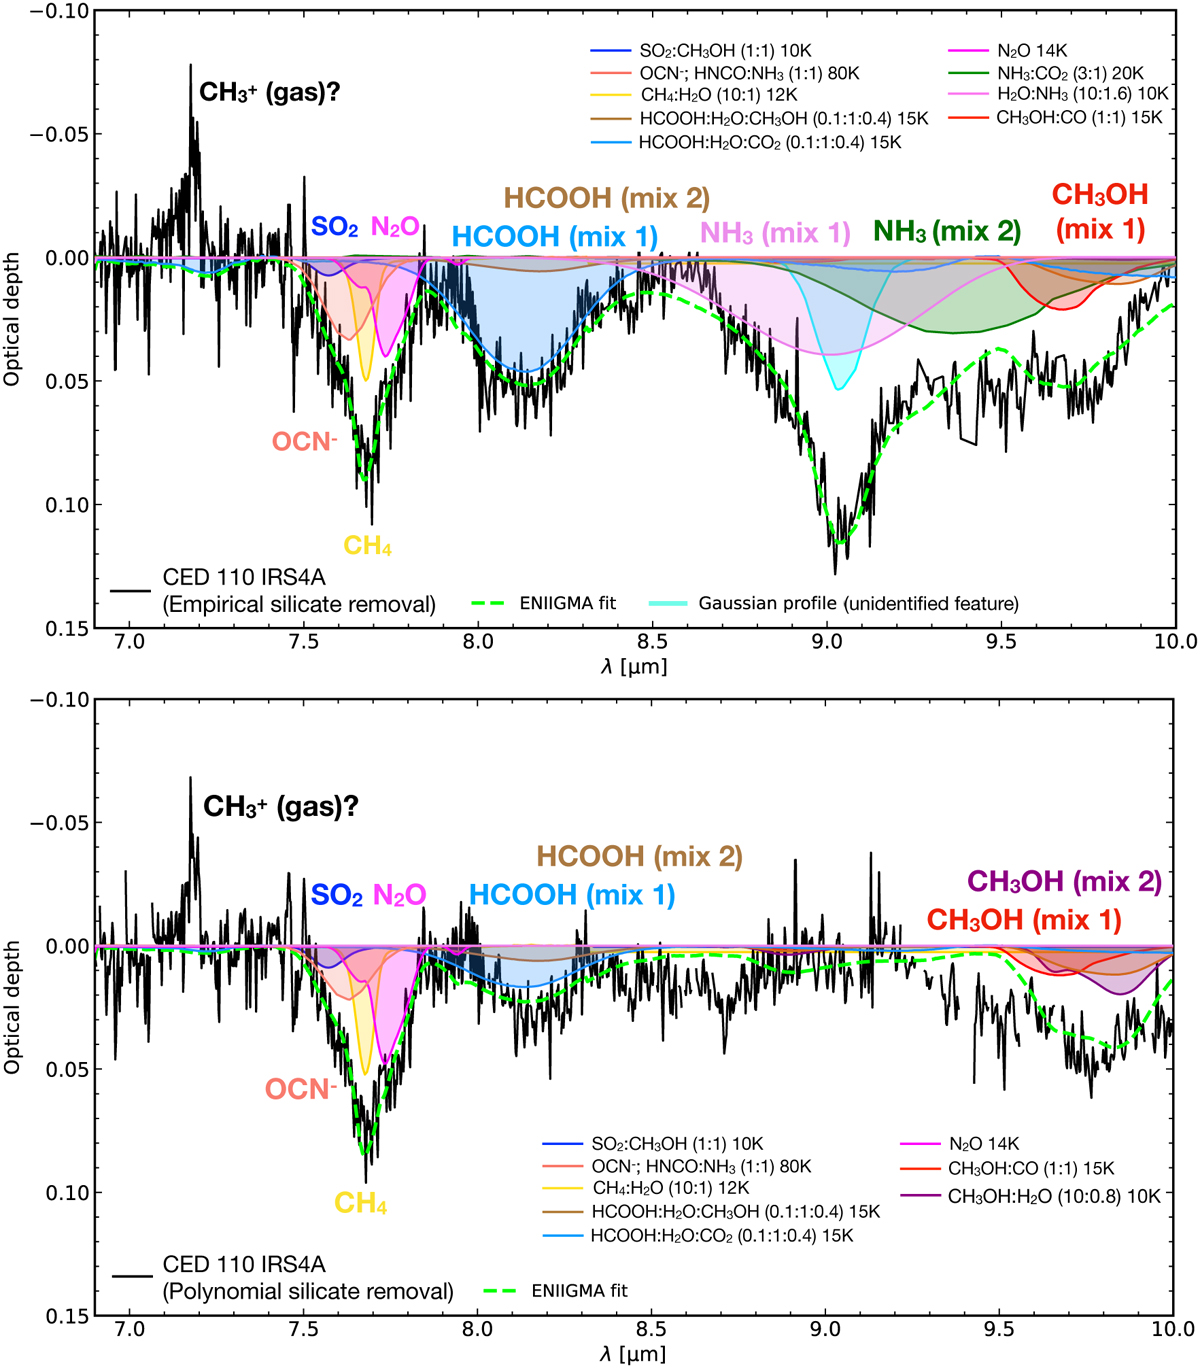
ENIIGMA fit (dashed green) in the range between 6.9 and 10 µm of Ced 110 IRS4A spectrum (black) after the empirical (top) and polynomial (bottom) silicate subtraction. The IR spectra of many ice species contribute to this fit and are indicated by labels and coloured areas. The terms “mix 1” and “mix 2” are used when two mixtures containing the same species are needed. The information of these mixtures is presented in the figure labels. We highlight that these best fits are based on the large laboratory ice database listed in Appendix C used to explore a variety of solutions. Other solutions can be further explored by expanding the database of species tested with new data. We refer Appendix F for a brief discussion of the ![]() emission feature.
emission feature.
Current usage metrics show cumulative count of Article Views (full-text article views including HTML views, PDF and ePub downloads, according to the available data) and Abstracts Views on Vision4Press platform.
Data correspond to usage on the plateform after 2015. The current usage metrics is available 48-96 hours after online publication and is updated daily on week days.
Initial download of the metrics may take a while.