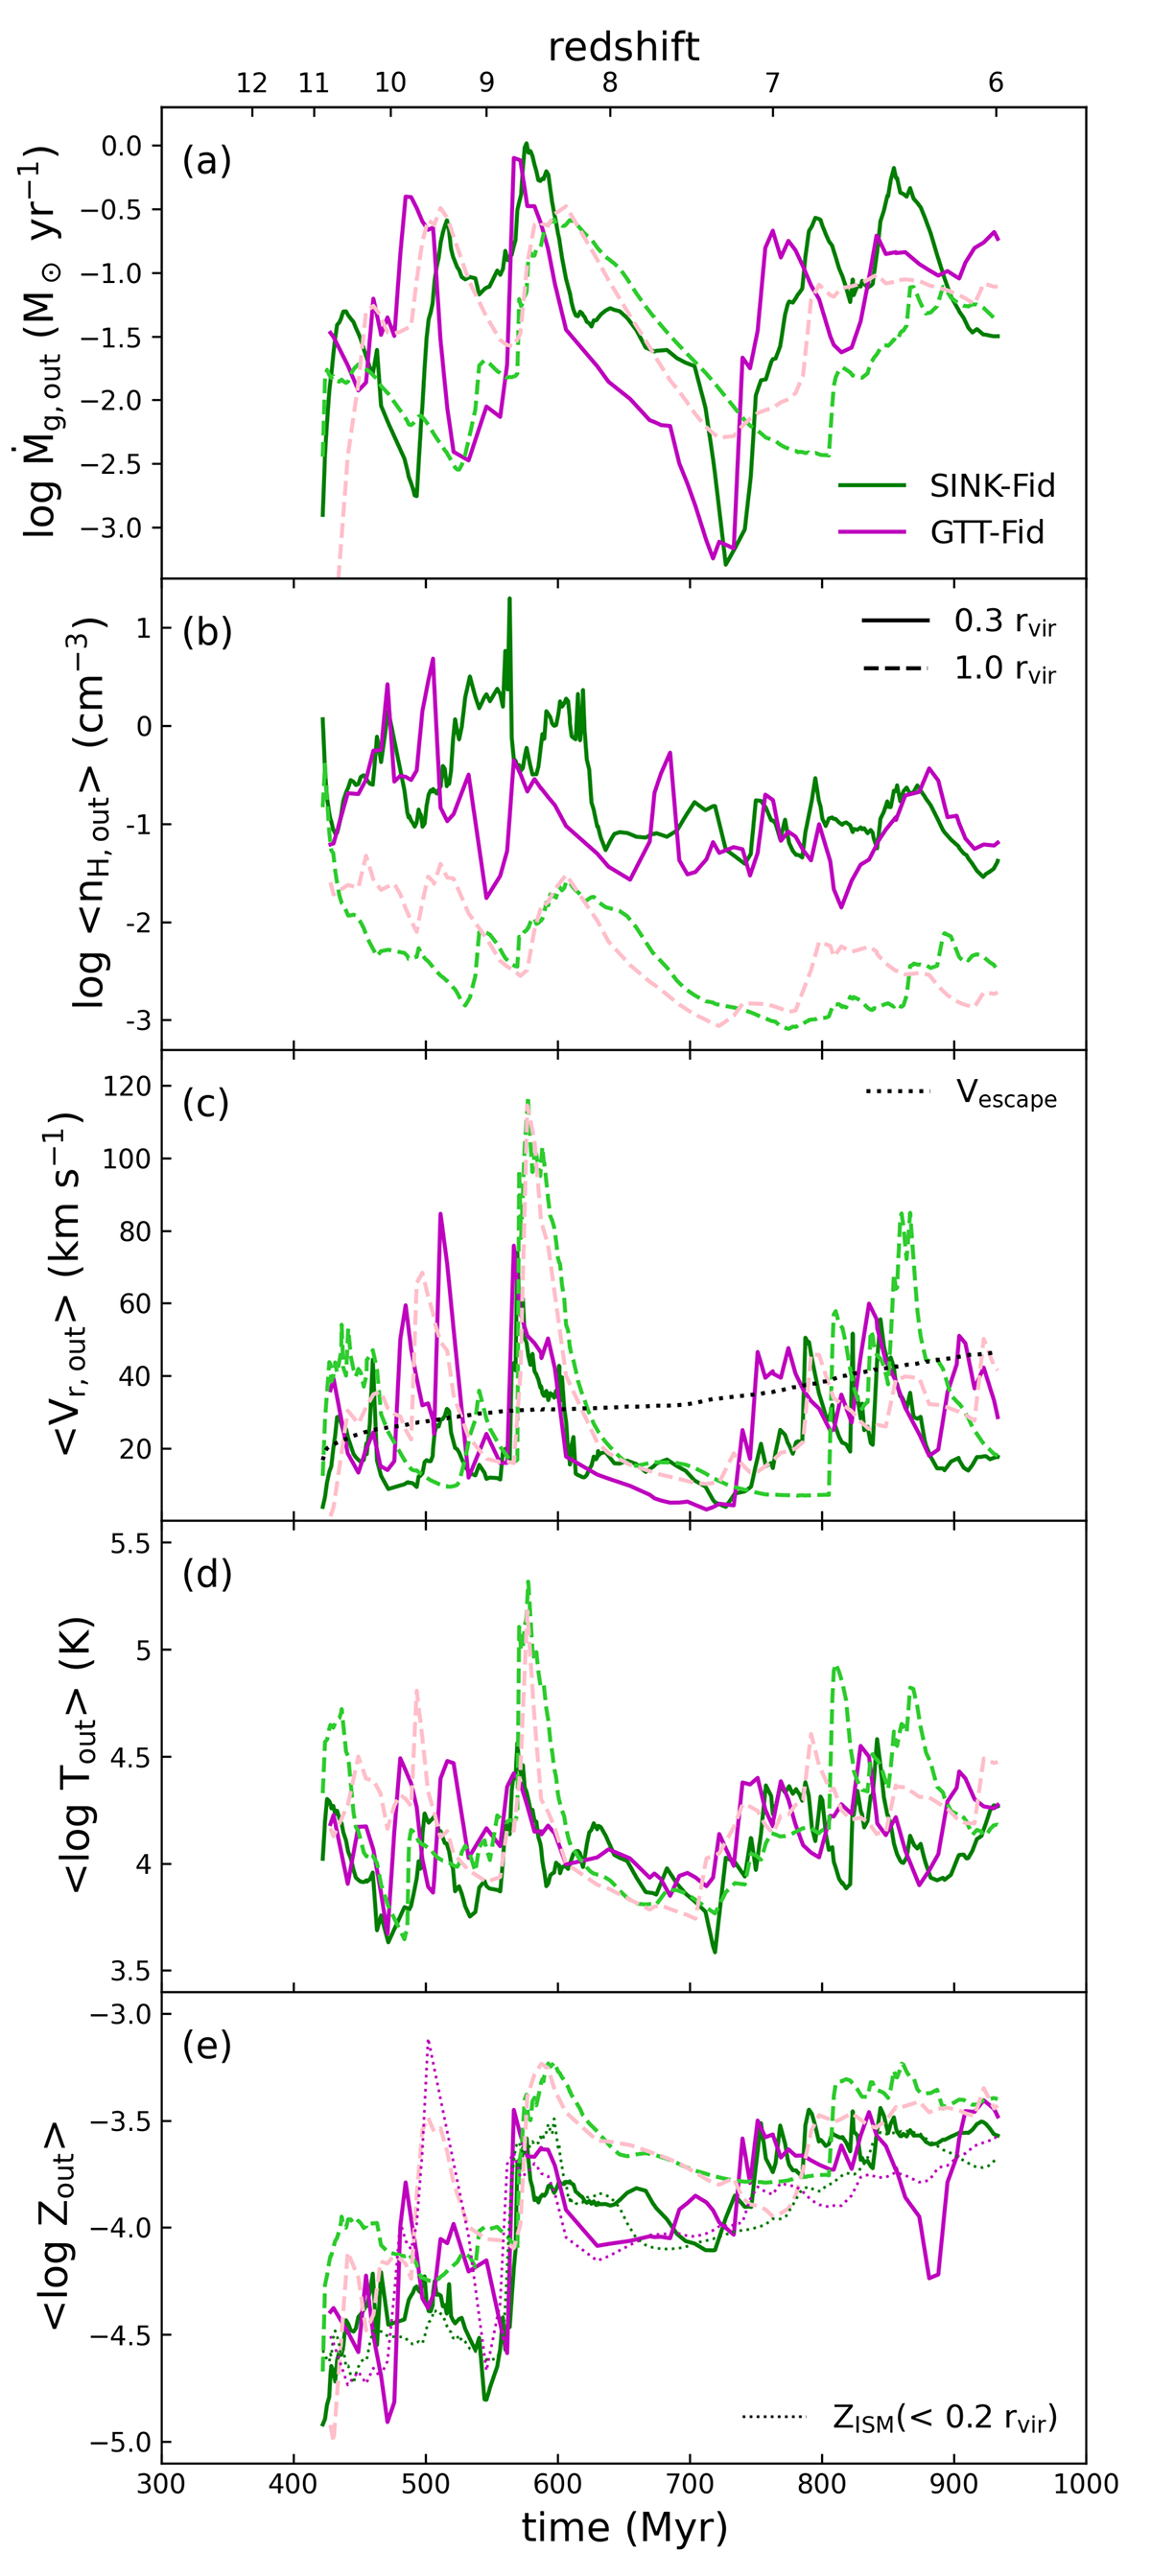
Fig. 7.
Download original image
Properties of gas outflows. From top to bottom: (a) the successive panels show outflow rate, (b) hydrogen number density, (c) radial velocity, (d) temperature, and (e) metallicity. Simulations with different star formation models are indicated by different color codes. Solid lines correspond to quantities measured at r = 0.3 rvir, while dashed lines are measurements at 1 rvir. The black dotted line in panel-(c) indicates the escape velocity from the DMH. Dotted lines in panel-(e) represent mean ISM metallicities within r = 0.2 rvir.
Current usage metrics show cumulative count of Article Views (full-text article views including HTML views, PDF and ePub downloads, according to the available data) and Abstracts Views on Vision4Press platform.
Data correspond to usage on the plateform after 2015. The current usage metrics is available 48-96 hours after online publication and is updated daily on week days.
Initial download of the metrics may take a while.