Fig. 4.
Download original image
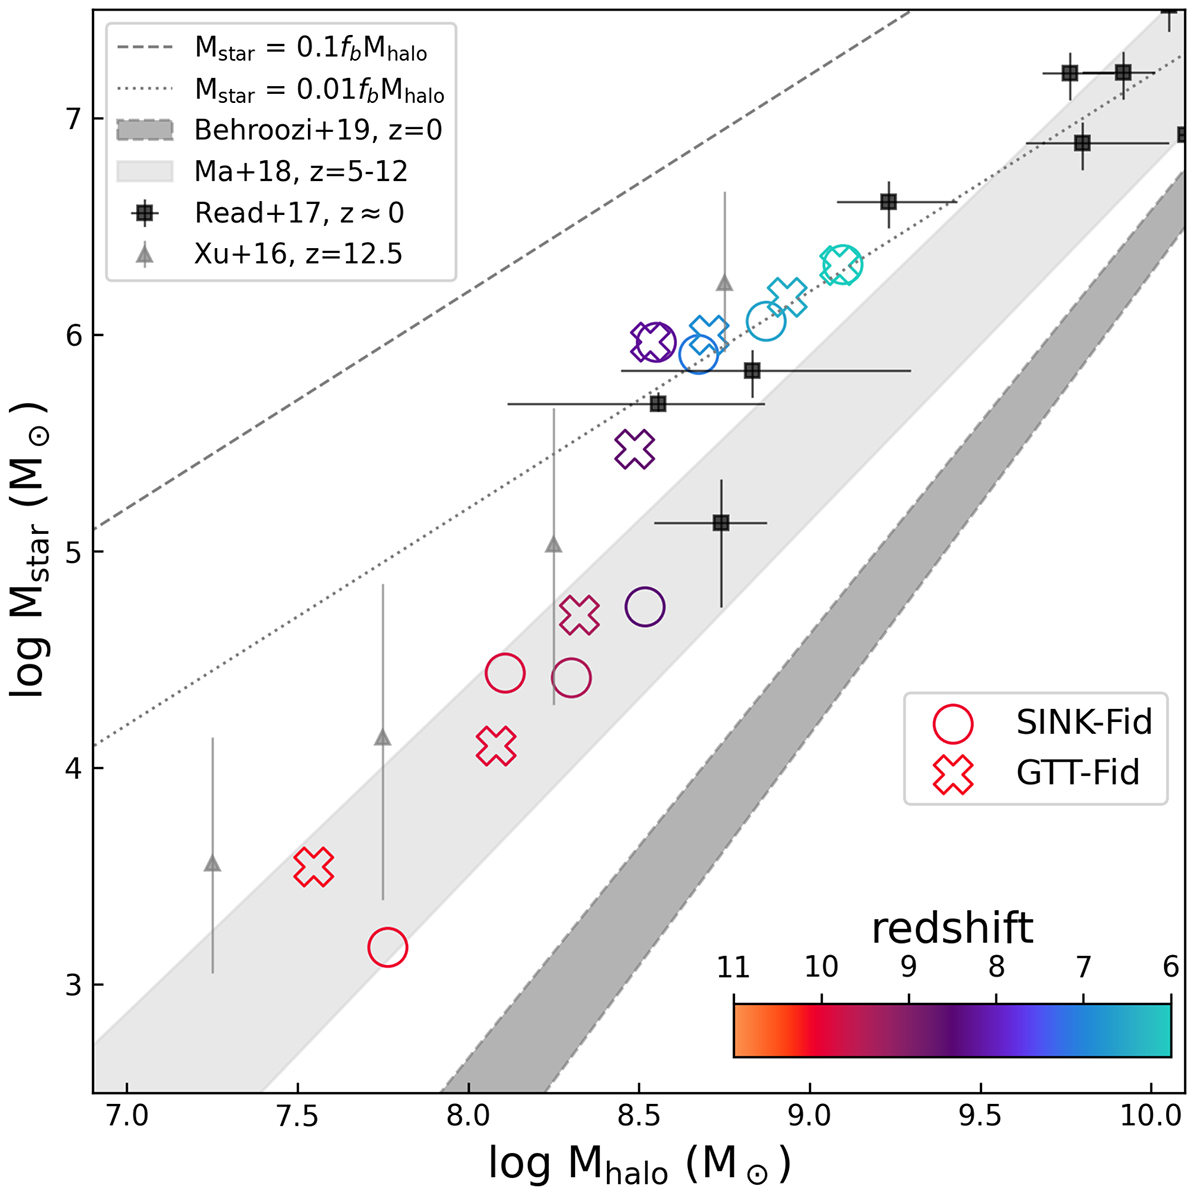
Galactic stellar mass as a function of DMH mass in our fiducial runs from z = 11 to 6. Different open symbols indicate the runs with different star formation models, with their colors representing the redshift. The dashed and dotted lines correspond to 10% and 1% gas-to-star conversion efficiencies, respectively. Also shown as dark and light shaded regions are the (extrapolated) relation at z = 0 (Behroozi et al. 2019) and at z = 5–12 (Ma et al. 2018) with 68% confidence intervals, respectively. The relation for the local field dwarfs is plotted as black squares (Read et al. 2017). The results of the Renaissance simulation are shown as gray triangles with vertical error bars indicating the 1σ range (Xu et al. 2016). Note that the stellar mass referred to here is the current mass, inclusive of mass loss from SNe, not the total mass of stars originally formed.
Current usage metrics show cumulative count of Article Views (full-text article views including HTML views, PDF and ePub downloads, according to the available data) and Abstracts Views on Vision4Press platform.
Data correspond to usage on the plateform after 2015. The current usage metrics is available 48-96 hours after online publication and is updated daily on week days.
Initial download of the metrics may take a while.