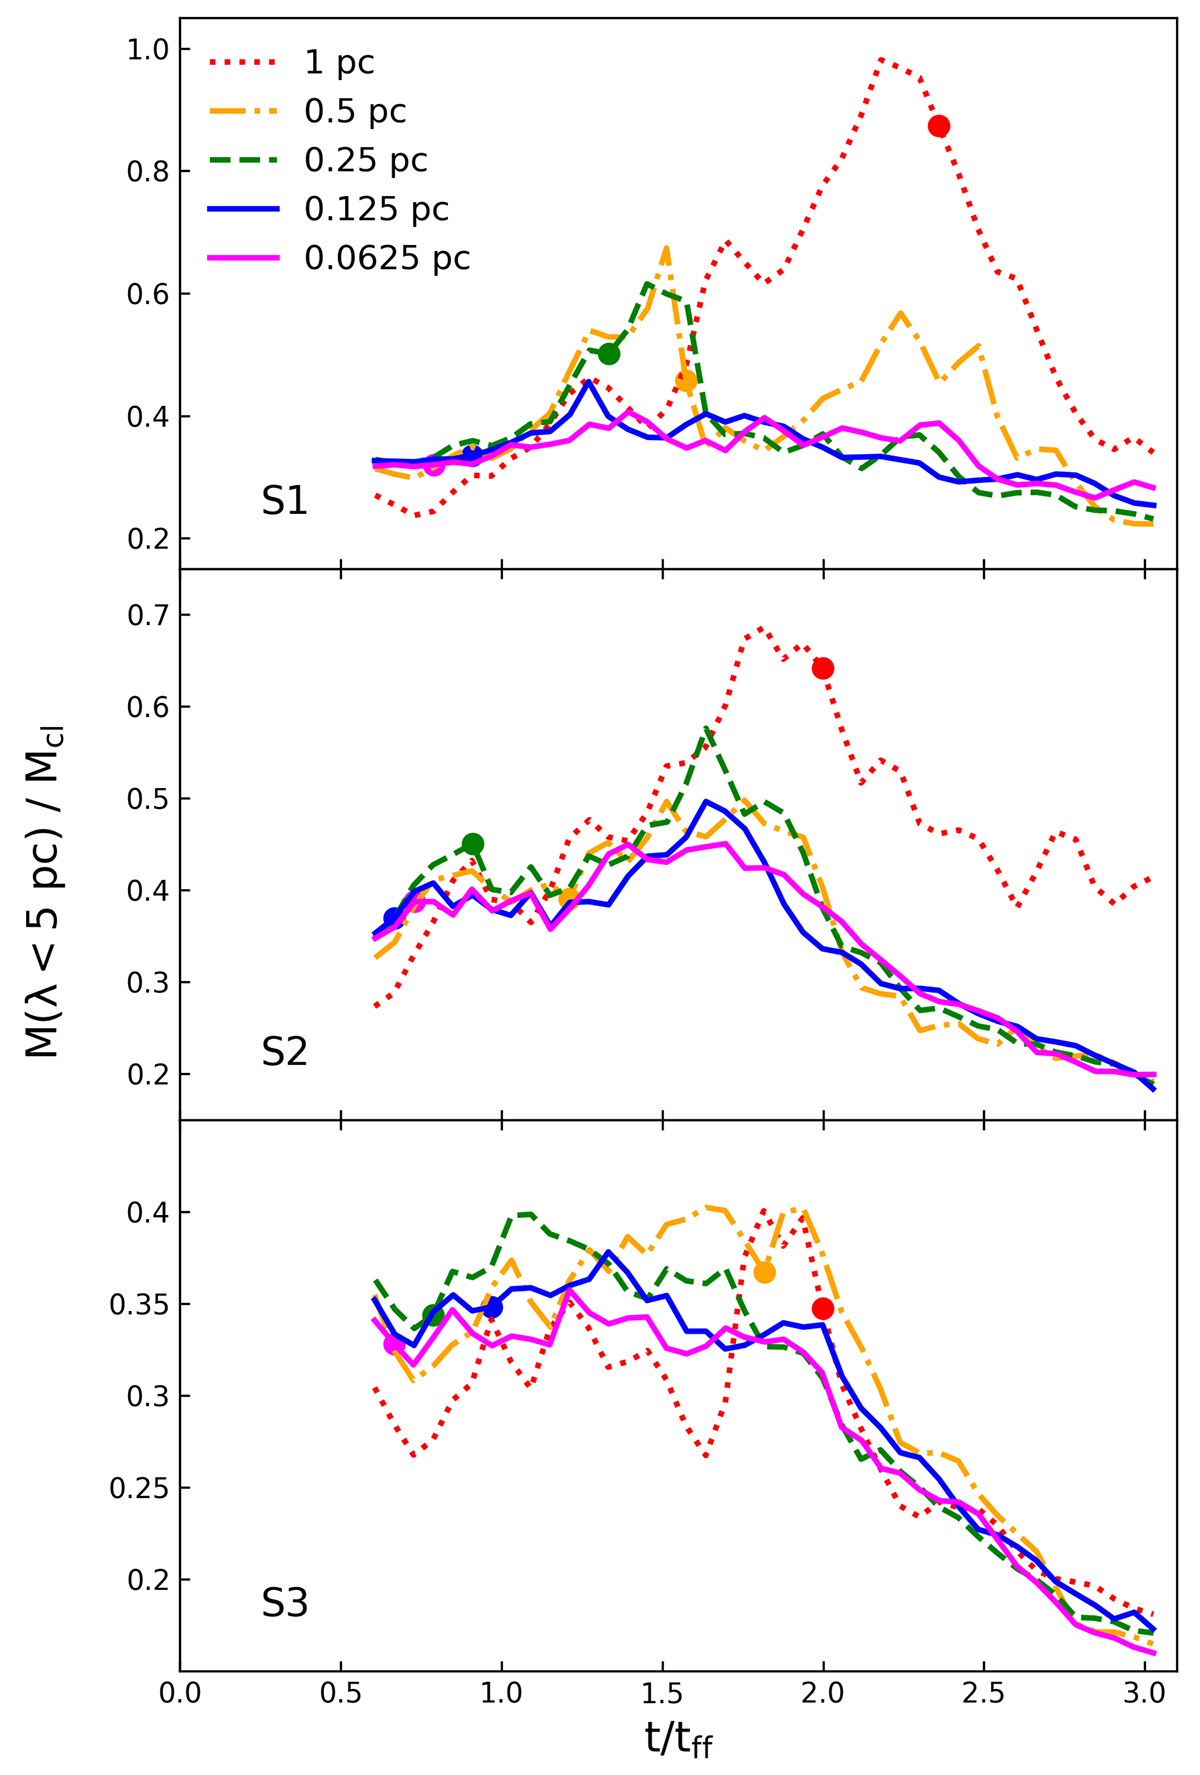
Fig. A.6.
Download original image
Mass fraction of the gas column density distribution reconstructed with a high pass filter (λ < 5 pc ) to the initial cloud mass (Mcl). This is done by performing an inverse Fourier transform on the Fourier transformed gas column density map of S1 (top), S2 (middle), and S3 (bottom) after removing signals from scales larger than 5 pc. The filled circle indicates the time at which the first sink particle is produced. The pronounced peaks in the lowest resolution runs of S1 and S2 indicate that the gas is slowly collapsing.
Current usage metrics show cumulative count of Article Views (full-text article views including HTML views, PDF and ePub downloads, according to the available data) and Abstracts Views on Vision4Press platform.
Data correspond to usage on the plateform after 2015. The current usage metrics is available 48-96 hours after online publication and is updated daily on week days.
Initial download of the metrics may take a while.