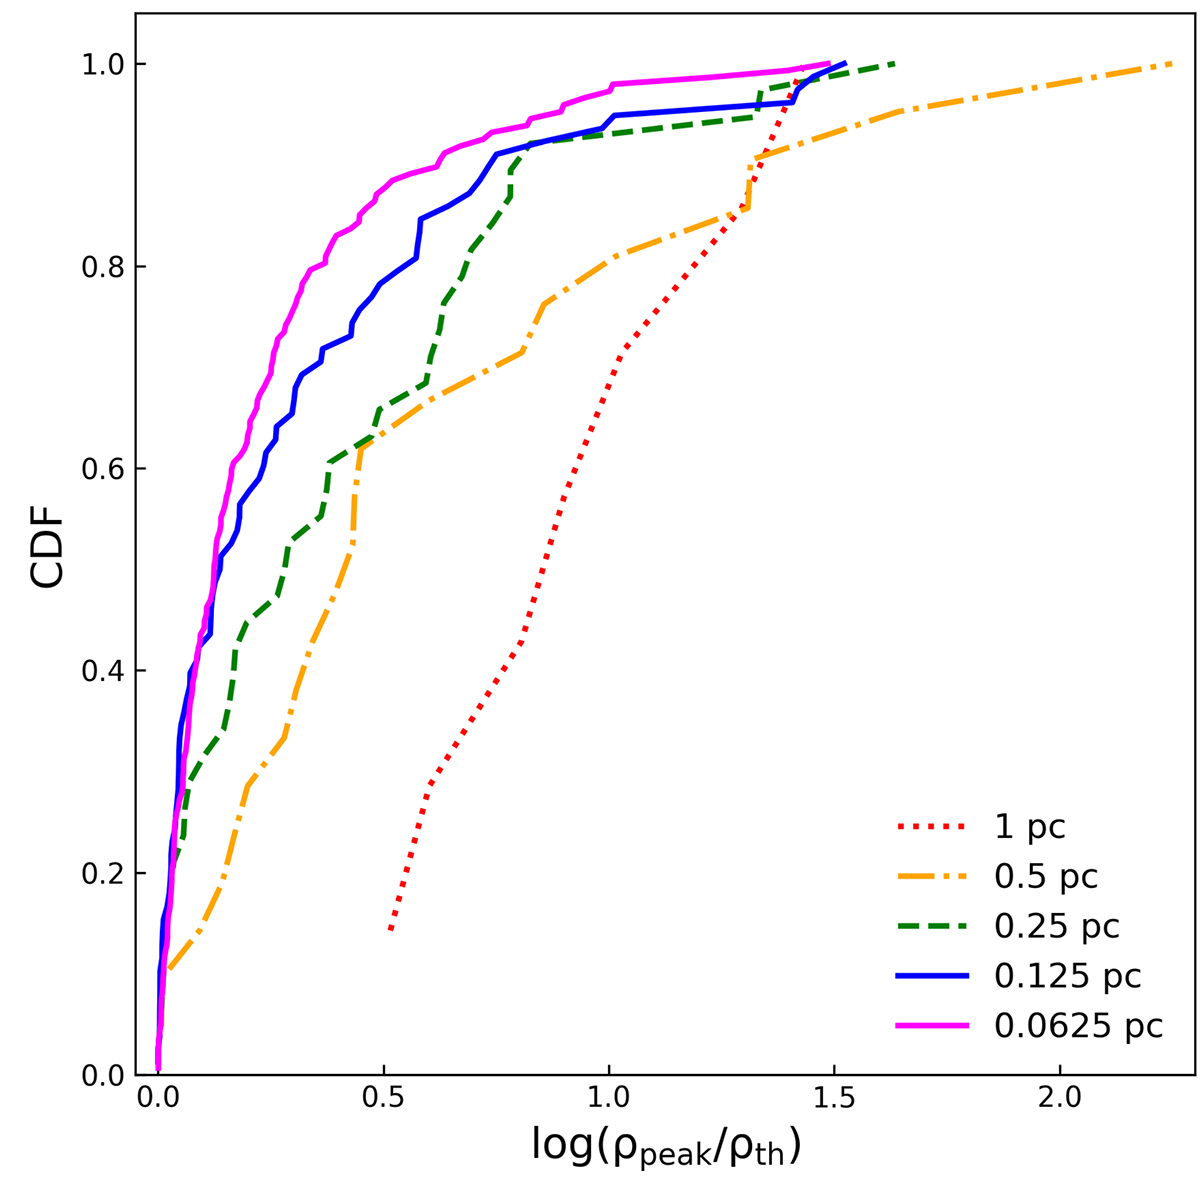
Fig. A.5.
Download original image
Cumulative distribution functions (CDFs) of the peak density of gas clumps at the time of sink formation (ρpeak), normalized to the threshold density for sink creation (ρth). The CDFs are computed by counting all sink particles from strongly turbulent GMCs (S1–S3), where the convergence in the SFEs is worse than in the weakly turbulent GMCs. Different colors and line styles correspond to CDFs from runs with different spatial resolutions, as indicated in the legend. Note that most of the sinks are created near ρth when the AMR resolution is high.
Current usage metrics show cumulative count of Article Views (full-text article views including HTML views, PDF and ePub downloads, according to the available data) and Abstracts Views on Vision4Press platform.
Data correspond to usage on the plateform after 2015. The current usage metrics is available 48-96 hours after online publication and is updated daily on week days.
Initial download of the metrics may take a while.