Fig. A.2.
Download original image
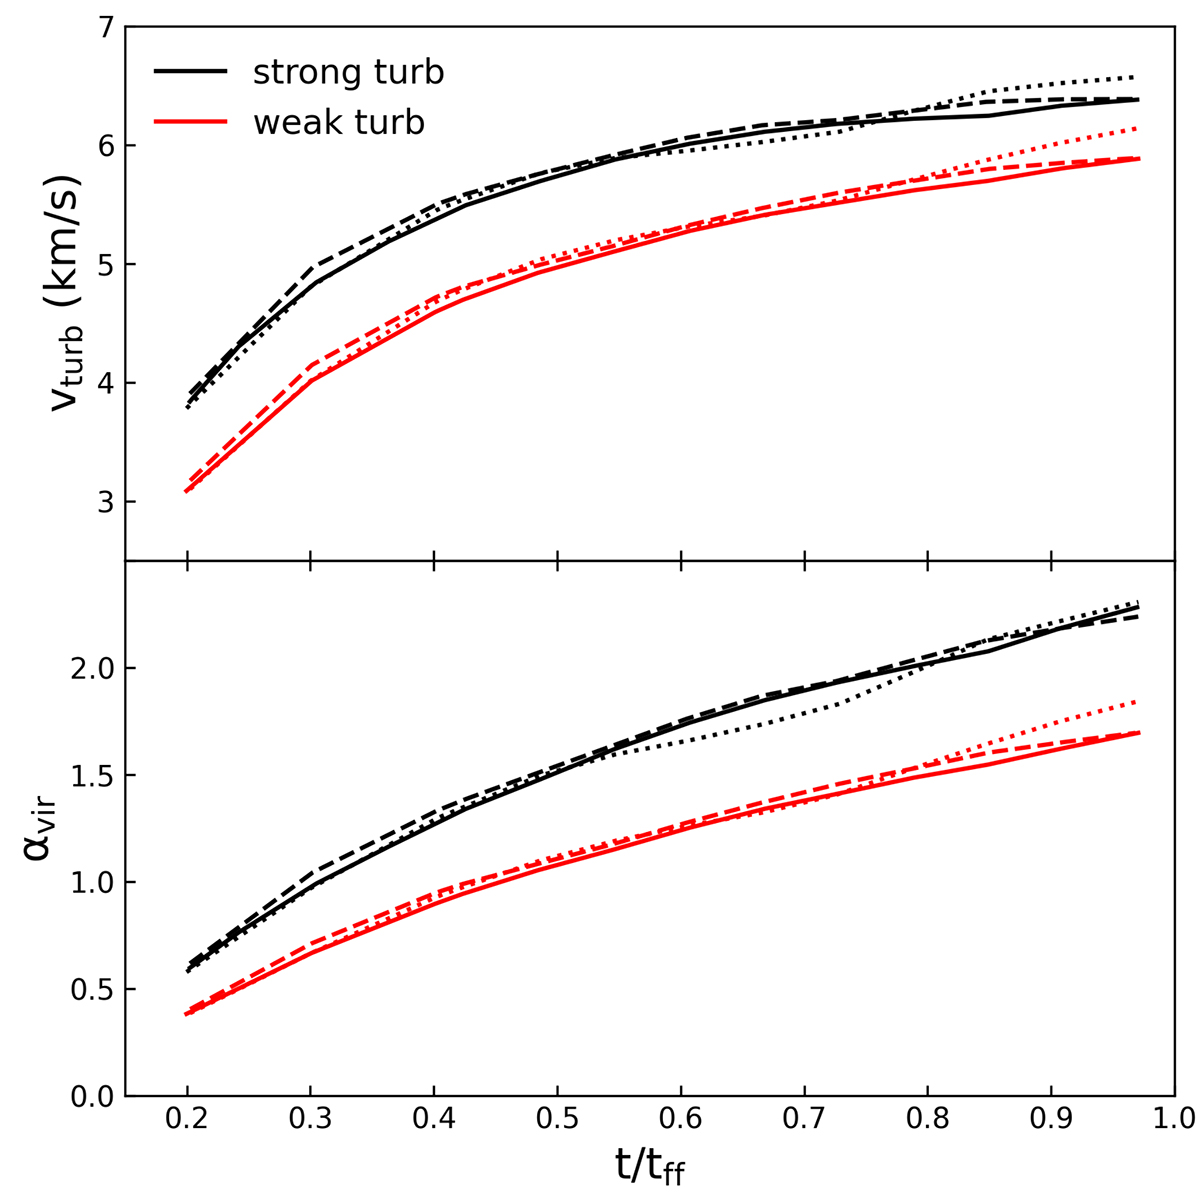
Time evolution of the turbulent velocity (top) and the virial parameter (bottom) measured inside a GMC with a radius of 20 pc. The time is normalized to the free-fall time of the cloud (≈ 3.3 Myr). The black and red lines correspond to the strong and weak turbulence runs with a resolution of 0.0625 pc, respectively. Different line styles represent the runs with different random seeds.
Current usage metrics show cumulative count of Article Views (full-text article views including HTML views, PDF and ePub downloads, according to the available data) and Abstracts Views on Vision4Press platform.
Data correspond to usage on the plateform after 2015. The current usage metrics is available 48-96 hours after online publication and is updated daily on week days.
Initial download of the metrics may take a while.