Fig. A.1.
Download original image
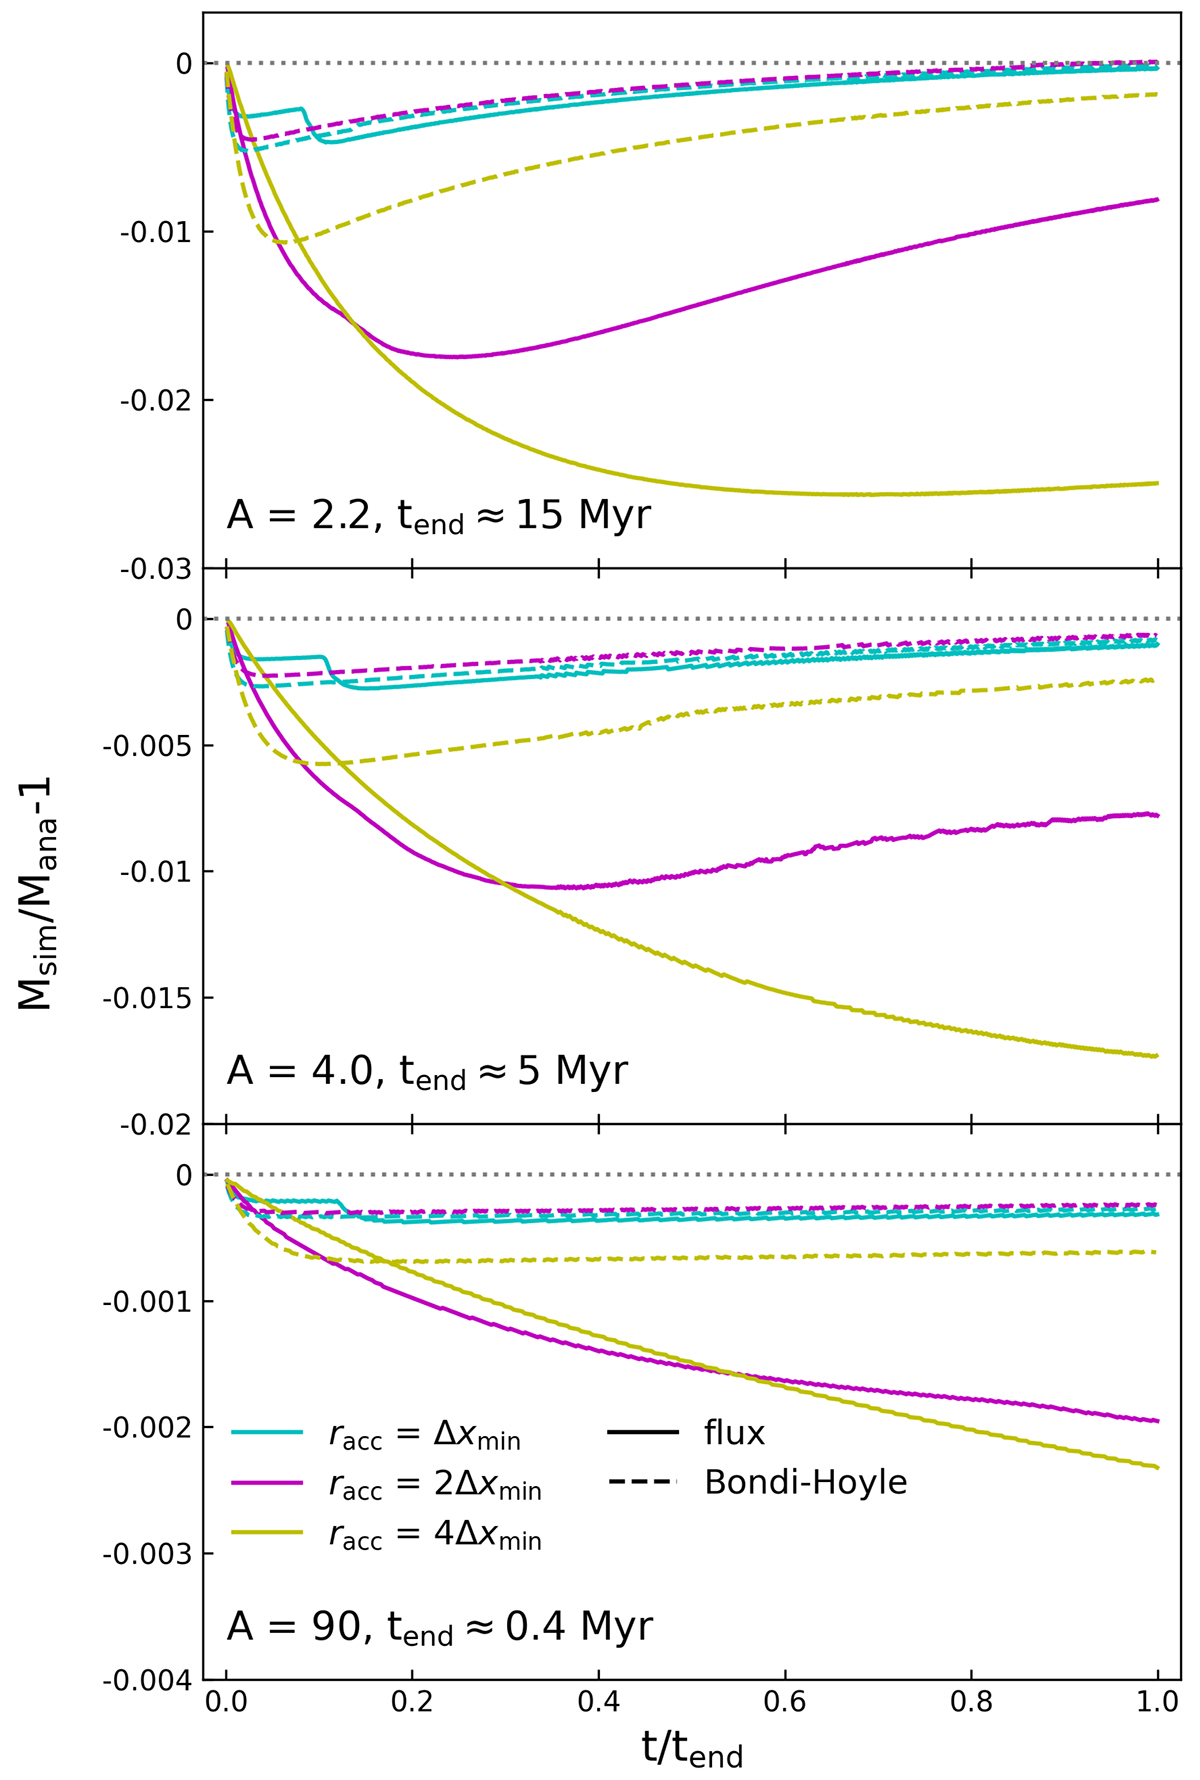
Relative error of the sink particle mass in collapsing isothermal sphere simulations with two different accretion schemes. We examine two values of A (2.2, 4.0) in Table 1 of Shu (1977) and an extreme case (90) where the mean gas density inside the accretion zone is similar to ρth. The lines with different colors represent the results of runs with different accretion radii, as indicated in the legend. The flux and Bondi-Hoyle accretion runs are shown as solid and dashed lines, respectively.
Current usage metrics show cumulative count of Article Views (full-text article views including HTML views, PDF and ePub downloads, according to the available data) and Abstracts Views on Vision4Press platform.
Data correspond to usage on the plateform after 2015. The current usage metrics is available 48-96 hours after online publication and is updated daily on week days.
Initial download of the metrics may take a while.