Fig. 1.
Download original image
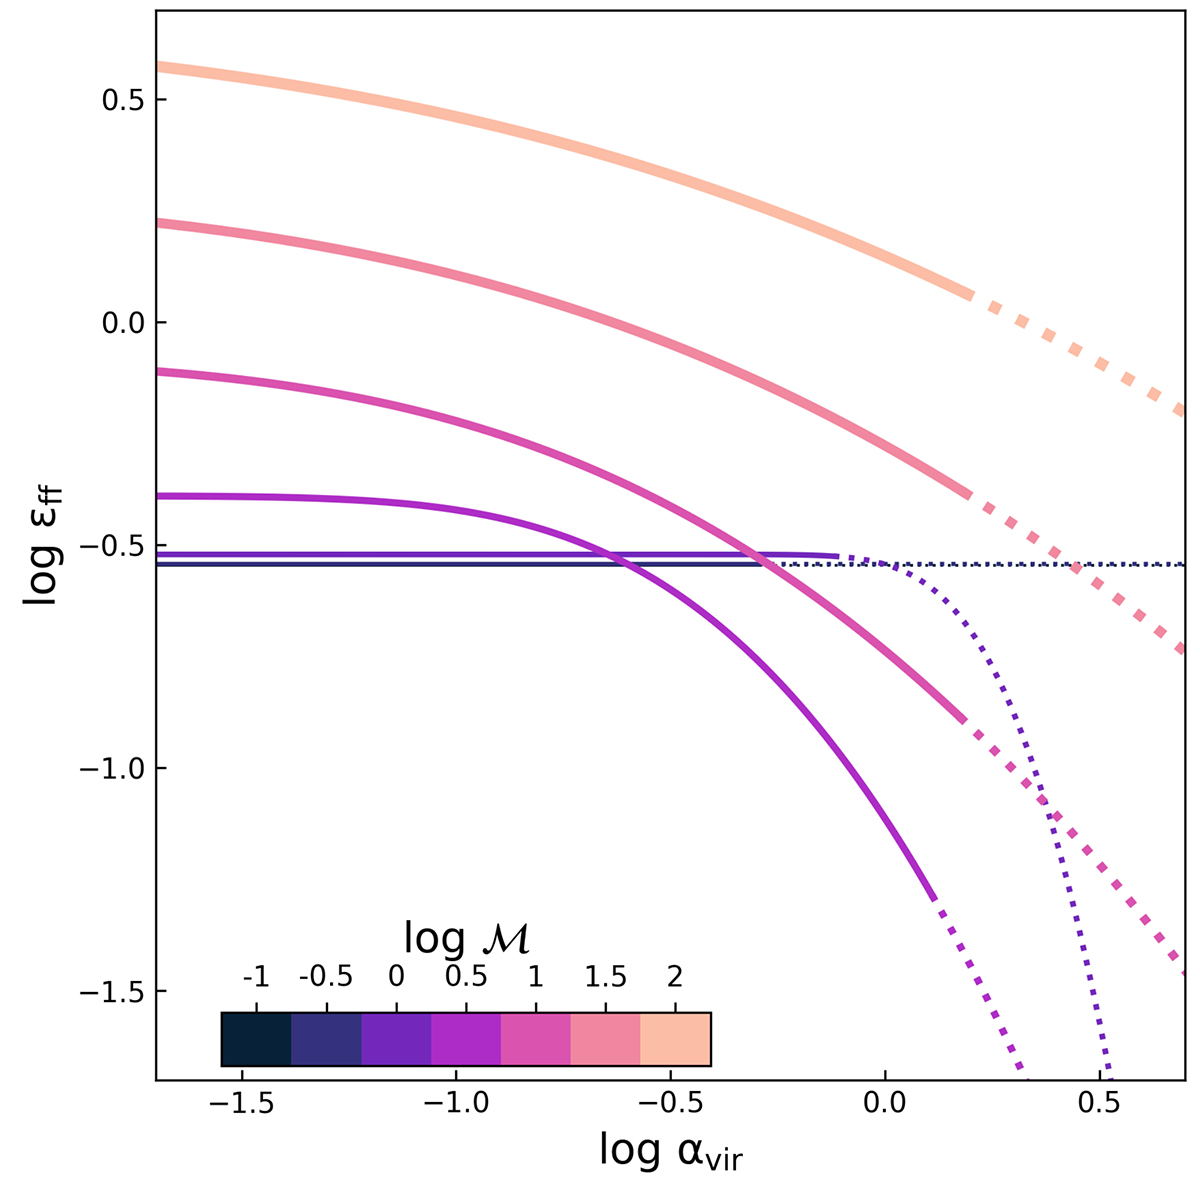
Star formation efficiency per free-fall time (εff) as a function of virial parameter (αvir) used in the local gravo-thermo-turbulent (GTT) subgrid model. We plot εff for seven different Mach numbers (ℳ) equally spaced in logarithmic intervals from 0.1 to 100. The curves for the two smallest ℳ overlap so only six curves are shown on the plot. The dotted lines indicate the region where star formation is inhibited according to Eq. (7).
Current usage metrics show cumulative count of Article Views (full-text article views including HTML views, PDF and ePub downloads, according to the available data) and Abstracts Views on Vision4Press platform.
Data correspond to usage on the plateform after 2015. The current usage metrics is available 48-96 hours after online publication and is updated daily on week days.
Initial download of the metrics may take a while.