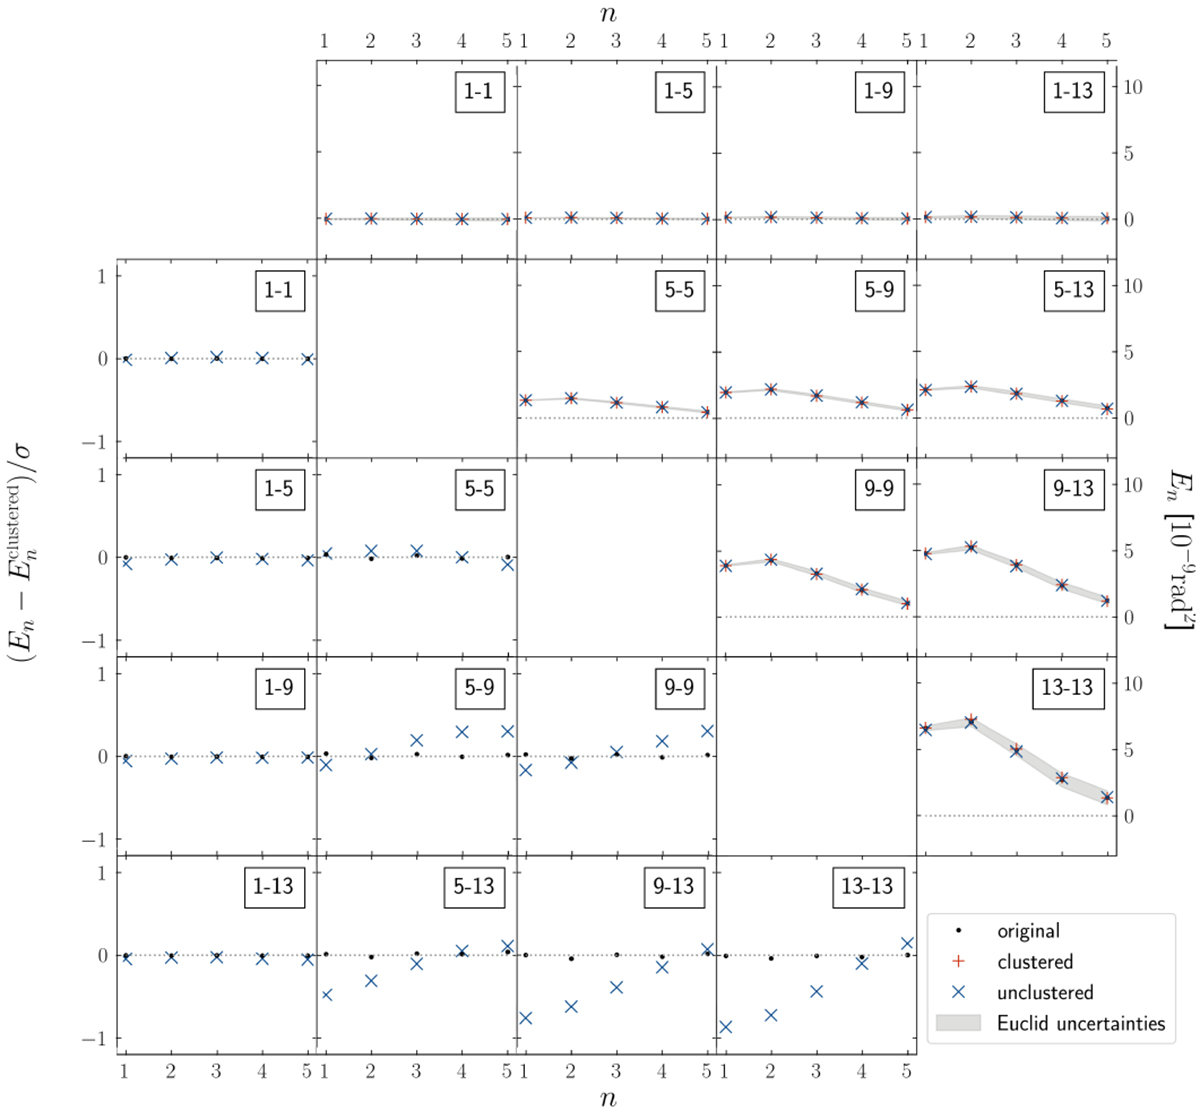
Fig. 8.
Download original image
Measurement for the Euclid-like set-up. Upper right: COSEBI E-modes En measured for the original FS2 galaxies (black points), the clustered catalogue (red plusses) and the unclustered catalogue (blue crosses) with the Euclid uncertainty (grey band) for a subset of the 13 tomographic bins. Lower left: Difference between En for the original and clustered sources (black points) and between the clustered and unclustered sources (blue crosses), divided by Euclid uncertainty. The full measurement for all tomographic bins is in Fig. E.8.
Current usage metrics show cumulative count of Article Views (full-text article views including HTML views, PDF and ePub downloads, according to the available data) and Abstracts Views on Vision4Press platform.
Data correspond to usage on the plateform after 2015. The current usage metrics is available 48-96 hours after online publication and is updated daily on week days.
Initial download of the metrics may take a while.