Fig. 4.
Download original image
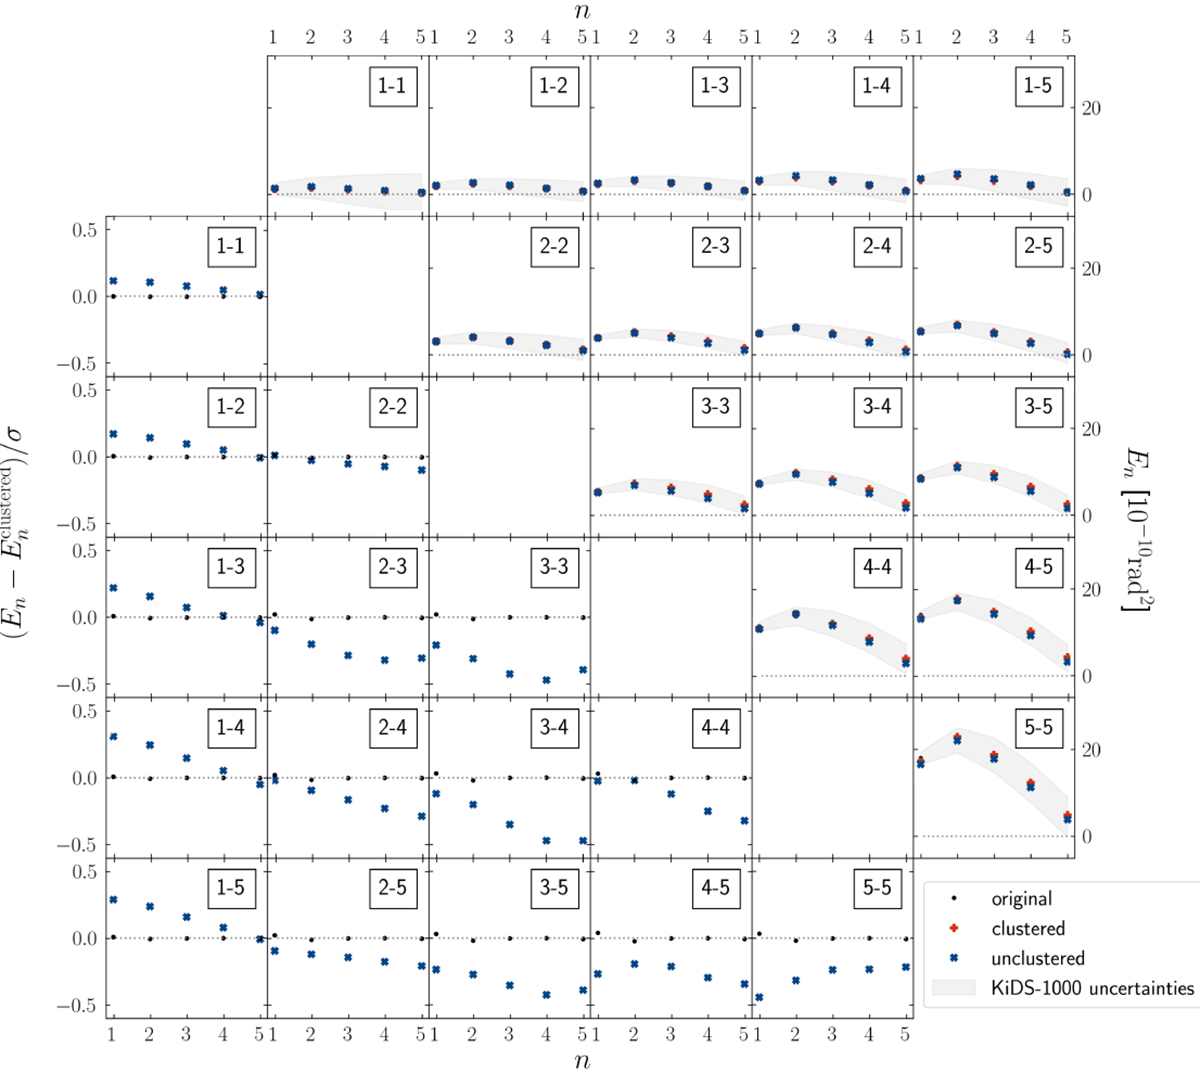
Measurement for the KiDS-like set-up. The x-axis denotes the COSEBI order n, each panel shows the measurement for one combination of tomographic bins, whose numbers are given in the upper right corner of each panel. Upper right: COSEBI E-modes En measured for the original MICE galaxies (black points), the clustered catalogue (red plusses) and the unclustered catalogue (blue crosses) with the KiDS-1000 uncertainty (grey band). Lower left: Difference between En for the original and clustered sources (black points) and between the clustered and unclustered sources (blue crosses), divided by the KiDS-1000 uncertainty. The original sources have shear and position taken directly from the MICE galaxy catalogue, while the clustered sources have their position taken from the catalogue and the shear assigned from the shear maps. The unclustered sources have uniformly distributed positions and shear assigned from the shear maps.
Current usage metrics show cumulative count of Article Views (full-text article views including HTML views, PDF and ePub downloads, according to the available data) and Abstracts Views on Vision4Press platform.
Data correspond to usage on the plateform after 2015. The current usage metrics is available 48-96 hours after online publication and is updated daily on week days.
Initial download of the metrics may take a while.