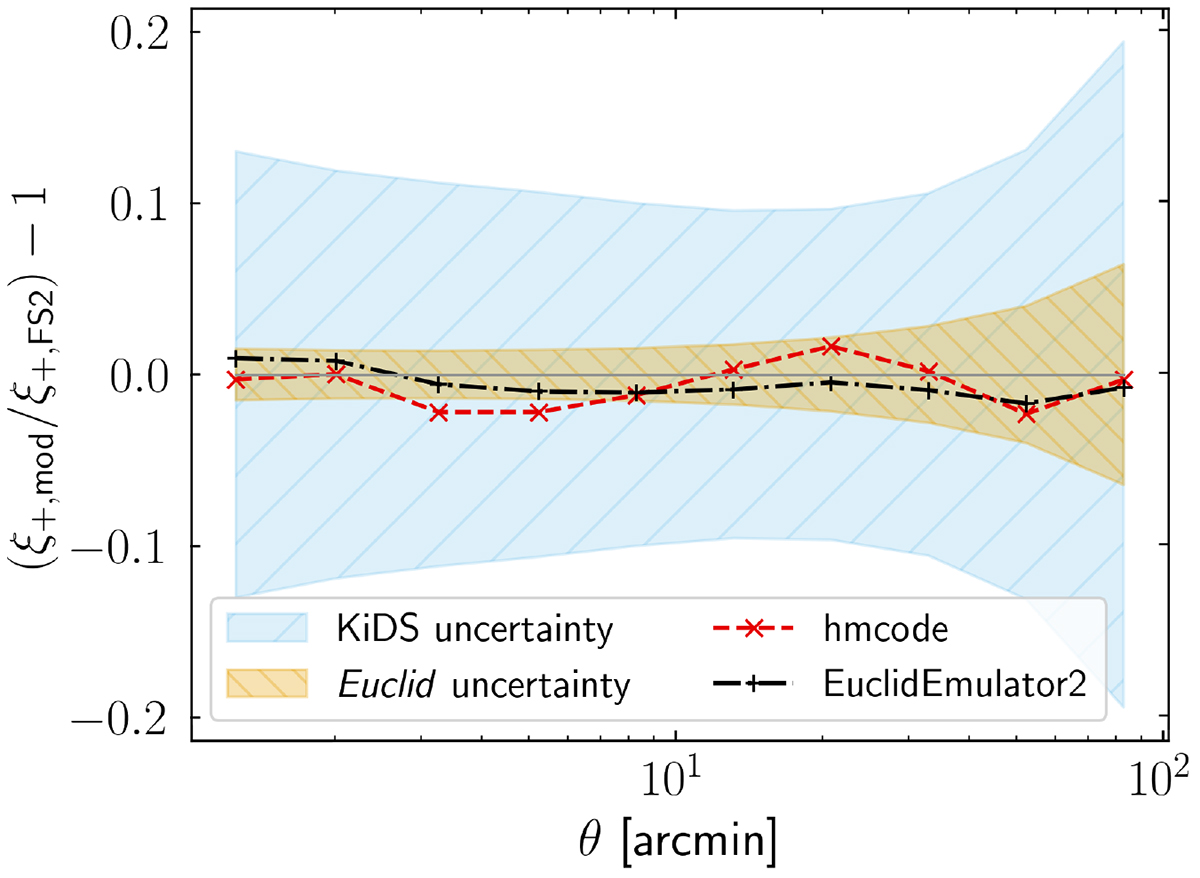
Fig. 3.
Download original image
Fractional difference between ξ+ modelled with HMCode-2020 (red, dashed) and the EuclidEmulator (black, dash-dotted) to the measurements in the FS2 for sources at 0.9 < z < 1.2. The blue area corresponds to the KiDS-1000 uncertainty and the yellow area to the Euclid uncertainty. The correlation function is binned here in 10 logarithmic bins between 1![]() 25 and 83′.
25 and 83′.
Current usage metrics show cumulative count of Article Views (full-text article views including HTML views, PDF and ePub downloads, according to the available data) and Abstracts Views on Vision4Press platform.
Data correspond to usage on the plateform after 2015. The current usage metrics is available 48-96 hours after online publication and is updated daily on week days.
Initial download of the metrics may take a while.