Fig. 1.
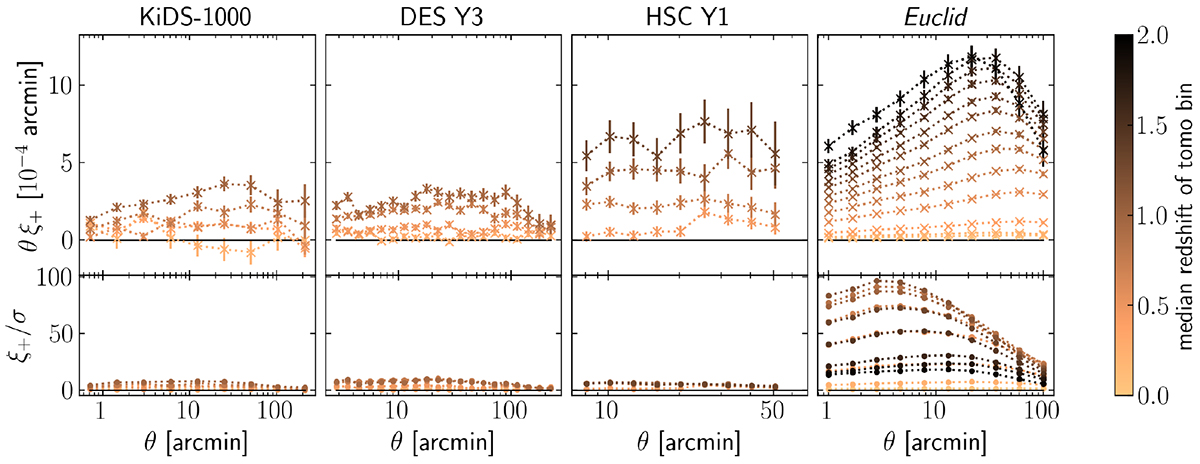
Download original image
Measured and expected weak lensing signals for stage III surveys and Euclid. Upper panel: Shear auto-correlations ξ+ for the stage III surveys KiDS (from Asgari et al. 2021), DES (from Amon et al. 2022), and HSC (from Hamana et al. 2020) with their reported errorbars and the expectation for Euclid. Error bars for Euclid are the square root of the covariance matrix diagonal, calculated as described in Sect. 4.1. The colour indicates the median redshift of the tomographic bins, with darker colours corresponding to higher redshifts. Lower panel: S/N of ξ+, given by dividing the measurement or prediction by the error bars.
Current usage metrics show cumulative count of Article Views (full-text article views including HTML views, PDF and ePub downloads, according to the available data) and Abstracts Views on Vision4Press platform.
Data correspond to usage on the plateform after 2015. The current usage metrics is available 48-96 hours after online publication and is updated daily on week days.
Initial download of the metrics may take a while.