Fig. 1.
Download original image
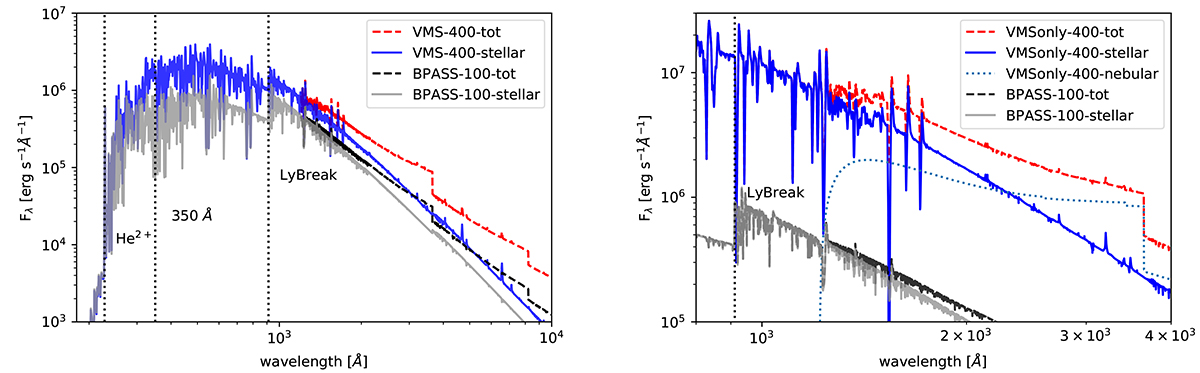
Comparison of predicted SEDs for a 1 Myr old population with and without VMS. Left panel: The standard BPASS model with Mup = 100 M⊙ is shown in gray (stellar emission only) and in black (including nebular continuum emission). Blue and red lines show the model extending up to 400 M⊙, the former including only stellar emission, the latter the total continuum (stellar plus nebular continuum). Right panel: zoom on the UV domain, comparison the standard BPASS model with a population including only VMS (from 100 to 400 M⊙). The dotted line shows the nebular continuum emission of the VMS-only-400 population.
Current usage metrics show cumulative count of Article Views (full-text article views including HTML views, PDF and ePub downloads, according to the available data) and Abstracts Views on Vision4Press platform.
Data correspond to usage on the plateform after 2015. The current usage metrics is available 48-96 hours after online publication and is updated daily on week days.
Initial download of the metrics may take a while.