Fig. 3
Download original image
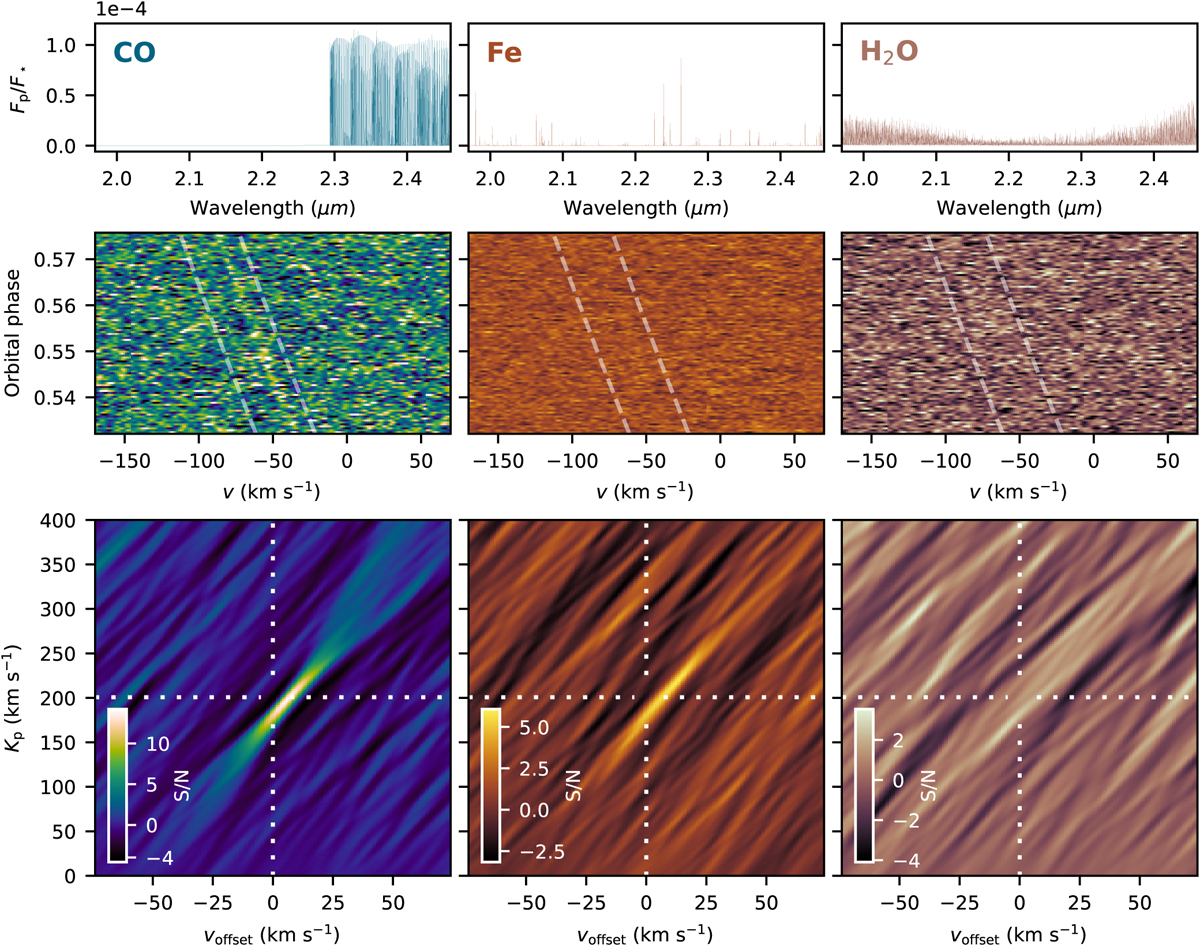
Model spectra (top), cross-correlation functions (CCFs, middle), and Kp-voffset maps (bottom) of CO, Fe and H2O. The dashed lines in the middle panels indicate the expected course of the planetary trail (which is located between the two lines). The signals of CO and Fe are visible in the CCFs and Kp-voffset maps, while H2O was not detectable.
Current usage metrics show cumulative count of Article Views (full-text article views including HTML views, PDF and ePub downloads, according to the available data) and Abstracts Views on Vision4Press platform.
Data correspond to usage on the plateform after 2015. The current usage metrics is available 48-96 hours after online publication and is updated daily on week days.
Initial download of the metrics may take a while.