Open Access
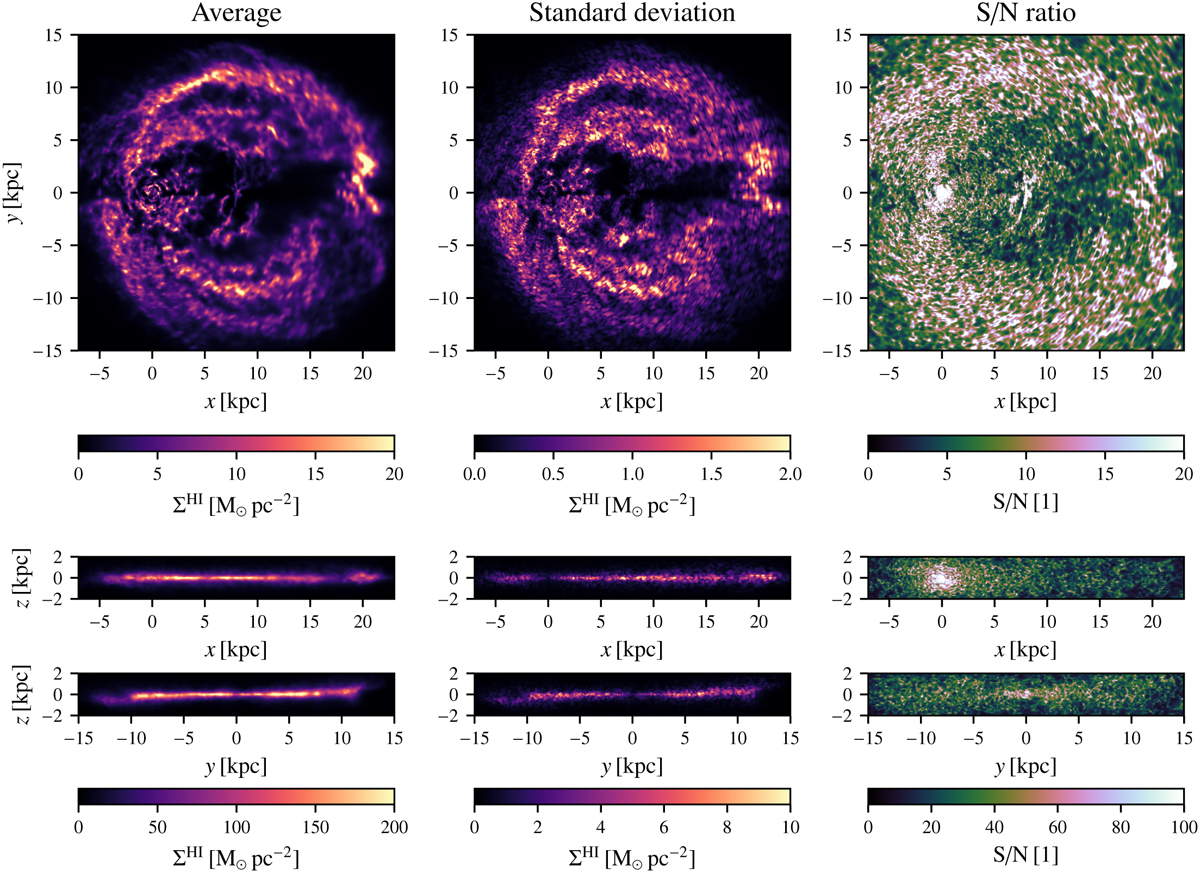
Fig. 9
Download original image
Projections of our 3D HI distribution along the x, y, and z axis. The left column shows the average surface mass density, the middle column shows the standard deviation thereof, and the right column shows the signal-to-noise ratio, i.e. the ratio of the first two columns. Note the different ranges on the colour-axes.
Current usage metrics show cumulative count of Article Views (full-text article views including HTML views, PDF and ePub downloads, according to the available data) and Abstracts Views on Vision4Press platform.
Data correspond to usage on the plateform after 2015. The current usage metrics is available 48-96 hours after online publication and is updated daily on week days.
Initial download of the metrics may take a while.