Open Access
Fig. 21
Download original image
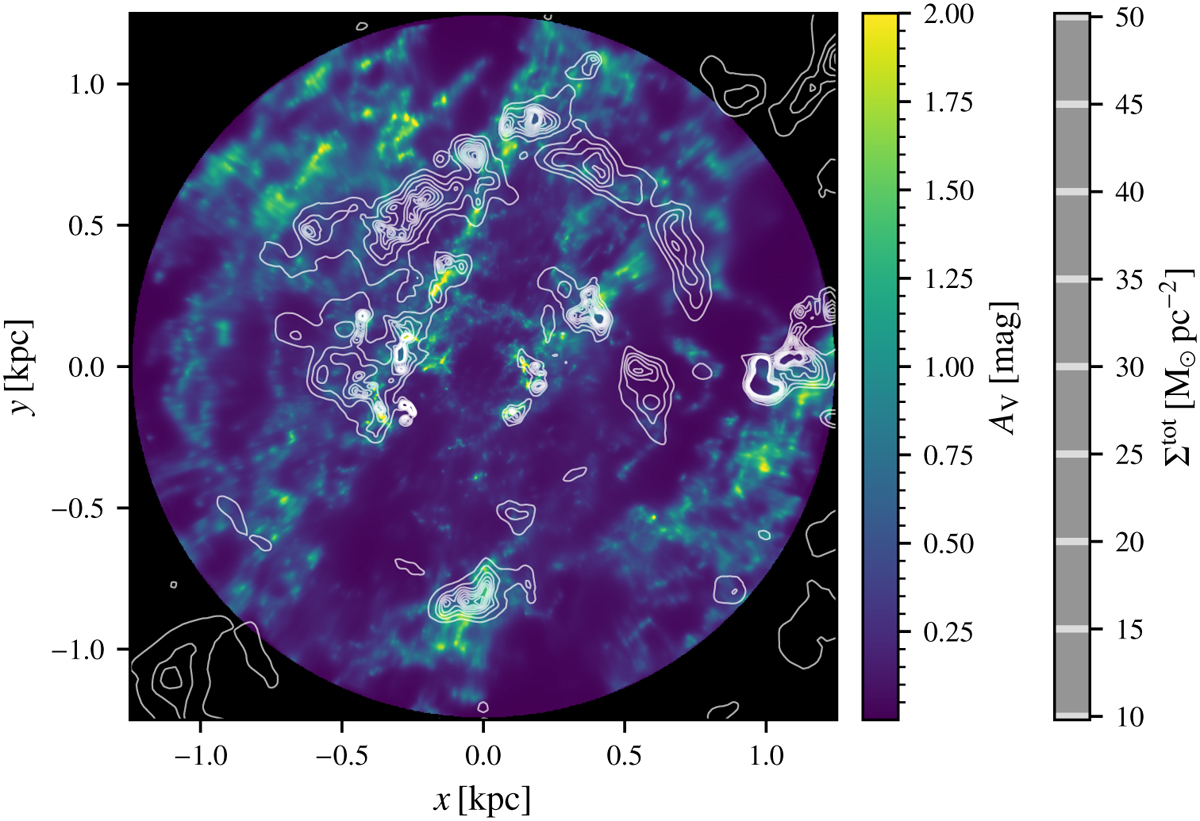
Local total Hydrogen density Σtot in comparison with the projected dust extinction by Edenhofer et al. (2024b). The coloured background shows the dust distribution, with no values available in the outer black regions. The white contours show the distribution of total gas density.
Current usage metrics show cumulative count of Article Views (full-text article views including HTML views, PDF and ePub downloads, according to the available data) and Abstracts Views on Vision4Press platform.
Data correspond to usage on the plateform after 2015. The current usage metrics is available 48-96 hours after online publication and is updated daily on week days.
Initial download of the metrics may take a while.