Fig. 16
Download original image
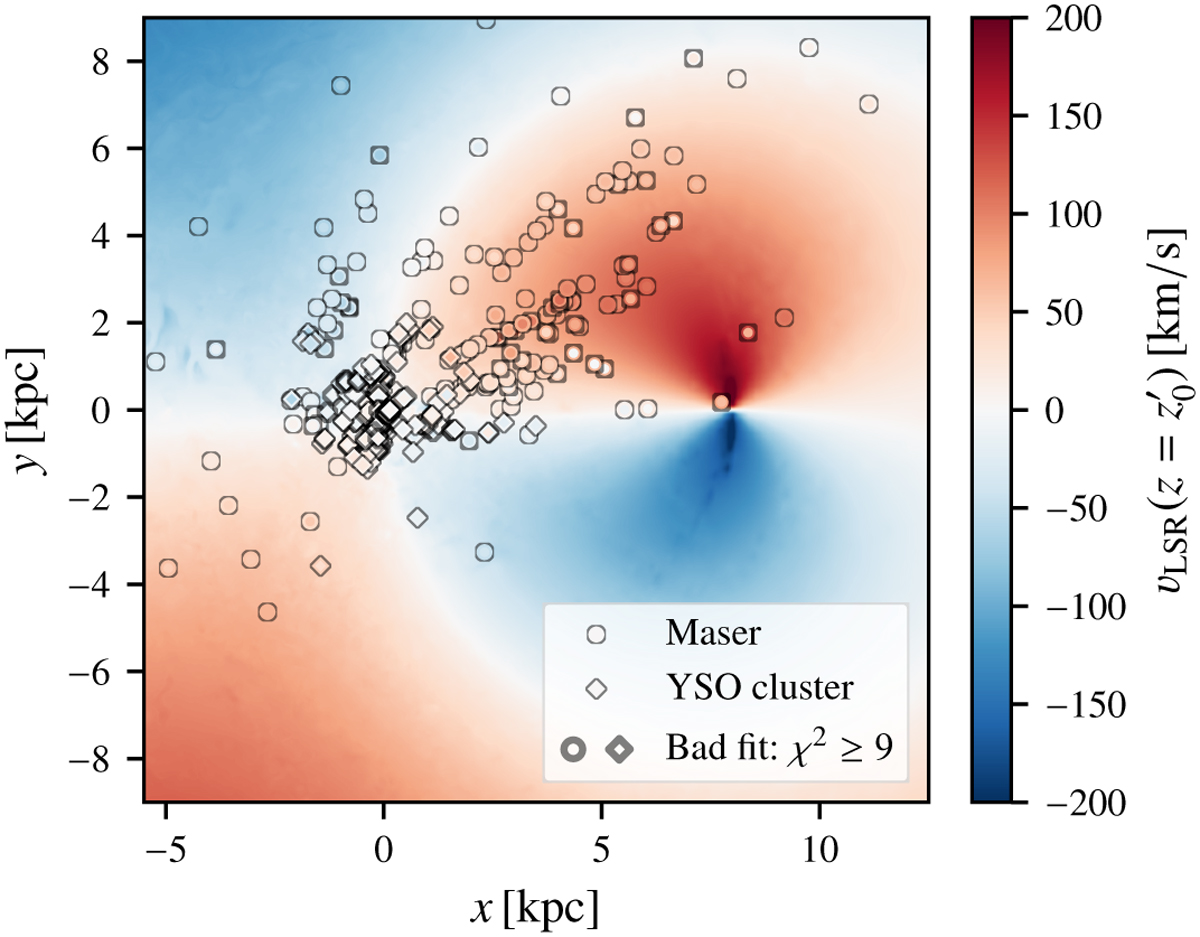
Mean LSR velocity at height ![]() , defined as the z coordinate corresponding to the maximum gas density at each x and y position, smoothed with a Gaussian filter with a 50 pc width. The markers are akin to Fig. 5 but consist of two parts: The inner part shows the measurement value and the outer part shows the mean value of the reconstructed velocity fields at the position of the tracer object. Markers with a thick grey edge indicate tracers whose radial velocity component is badly reproduced by the reconstructed velocity field.
, defined as the z coordinate corresponding to the maximum gas density at each x and y position, smoothed with a Gaussian filter with a 50 pc width. The markers are akin to Fig. 5 but consist of two parts: The inner part shows the measurement value and the outer part shows the mean value of the reconstructed velocity fields at the position of the tracer object. Markers with a thick grey edge indicate tracers whose radial velocity component is badly reproduced by the reconstructed velocity field.
Current usage metrics show cumulative count of Article Views (full-text article views including HTML views, PDF and ePub downloads, according to the available data) and Abstracts Views on Vision4Press platform.
Data correspond to usage on the plateform after 2015. The current usage metrics is available 48-96 hours after online publication and is updated daily on week days.
Initial download of the metrics may take a while.