Open Access
Fig. 10.
Download original image
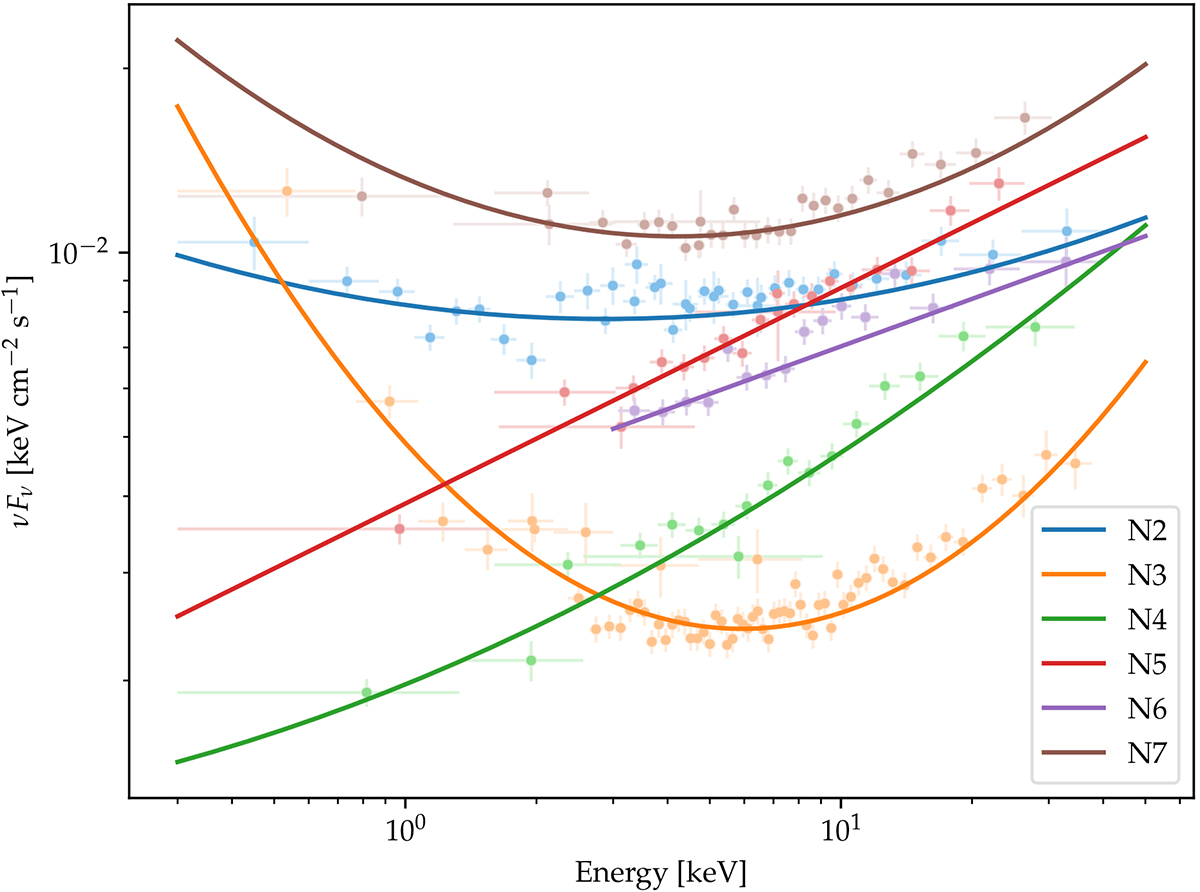
The models of spectral energy distributions of BL Lacertae obtained based on NuSTAR and Swift/XRT simultaneous observations. Different colours denote separate epochs of observations as defined in Table 1. Data points for each set of observations are denoted with the same colours.
Current usage metrics show cumulative count of Article Views (full-text article views including HTML views, PDF and ePub downloads, according to the available data) and Abstracts Views on Vision4Press platform.
Data correspond to usage on the plateform after 2015. The current usage metrics is available 48-96 hours after online publication and is updated daily on week days.
Initial download of the metrics may take a while.