Fig. 2
Download original image
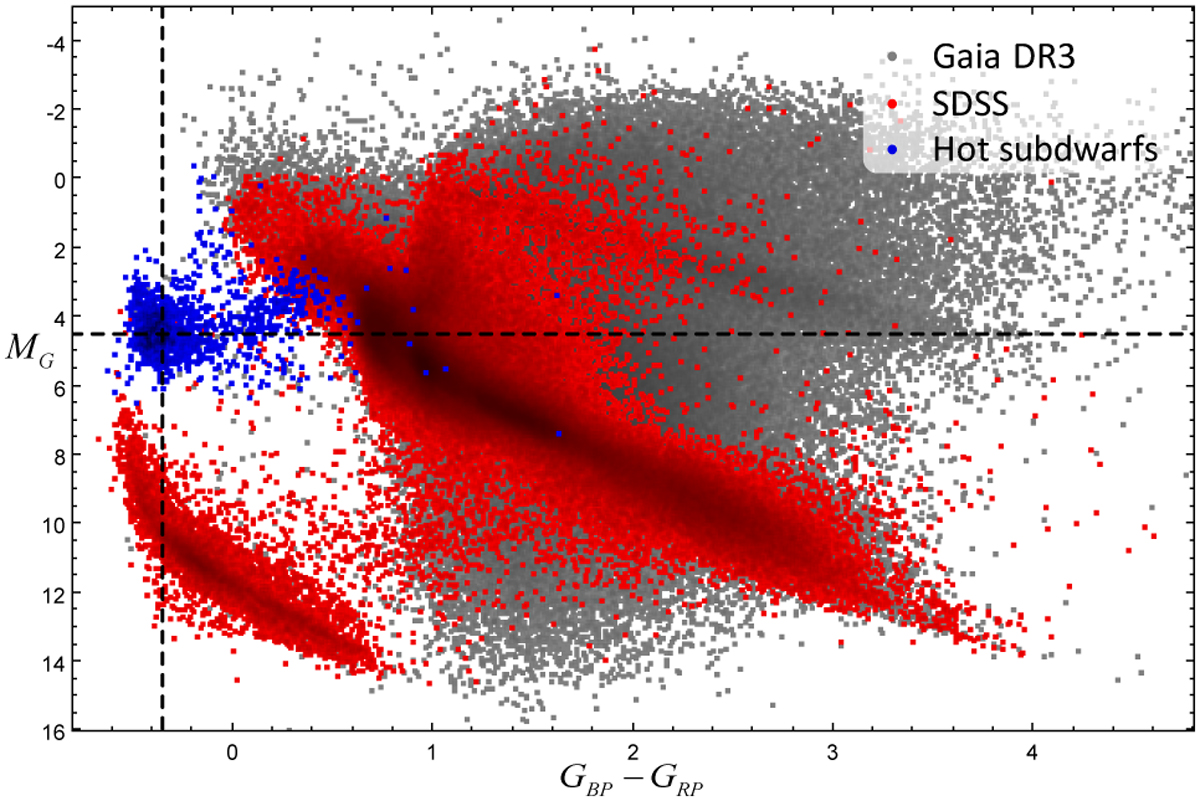
HR diagram of Gaia DR3, where grey points represent samples from Gaia DR3, red points depict stars with spectral classifications in SDSS DR17, and blue points indicate samples of known hot subdwarfs. The two black dashed lines mark the concentrated distribution region of known hot subdwarfs (GBP − GRP ~ −0.35 and MG ~ 4.5). It is worth noting that the stars plotted on the figure have been filtered according to the criteria used for constructing the Gaia HR diagram, as detailed in Eq. (18).
Current usage metrics show cumulative count of Article Views (full-text article views including HTML views, PDF and ePub downloads, according to the available data) and Abstracts Views on Vision4Press platform.
Data correspond to usage on the plateform after 2015. The current usage metrics is available 48-96 hours after online publication and is updated daily on week days.
Initial download of the metrics may take a while.