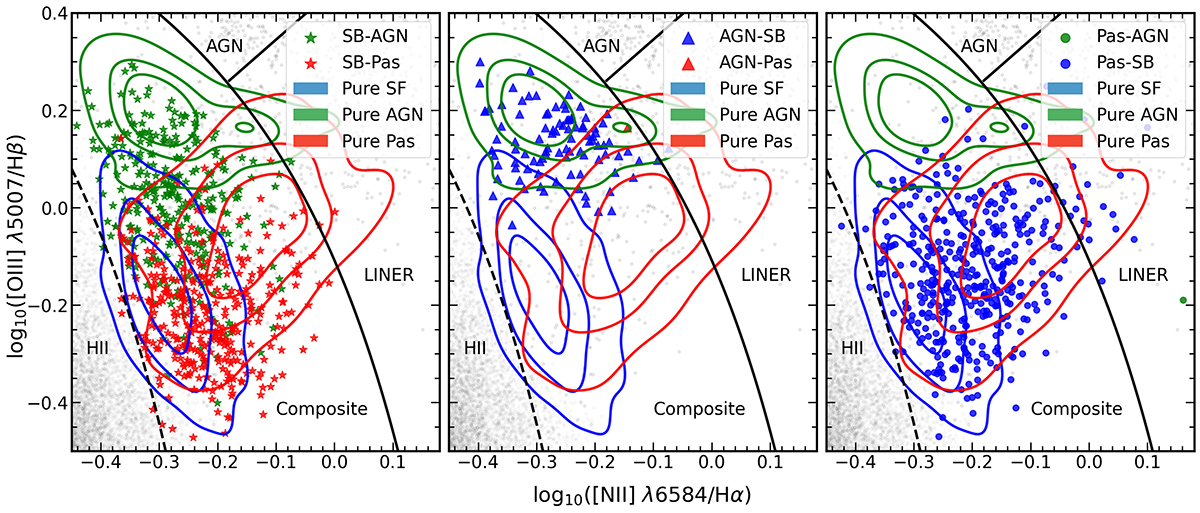
Fig. 8.
Download original image
[O III]/Hβ vs. [N II]/Hα flux ratio, illustrating the positions of each refined activity class as predicted by our diagnostic tool after applying it on a sample of spectroscopically selected composite galaxies. We utilized the DONHa classification scheme outlined in Table 3. The left, middle, and right panel indicates spectra excited by star formation (SB), AGN activity, and old stellar populations (Pas), respectively. The contours denote galaxies predicted to exclusively belong to one of the primary activity classes (max_pi > 90%), while the data points represent galaxies with mixed activities (max_pi < 90%). In each plot the symbols represent the class with the highest predicted probability, while the colors the class with second-highest probability. The black boundary lines are the same as defined in Fig. 2. The black dots represent the training sample for demonstration purposes.
Current usage metrics show cumulative count of Article Views (full-text article views including HTML views, PDF and ePub downloads, according to the available data) and Abstracts Views on Vision4Press platform.
Data correspond to usage on the plateform after 2015. The current usage metrics is available 48-96 hours after online publication and is updated daily on week days.
Initial download of the metrics may take a while.