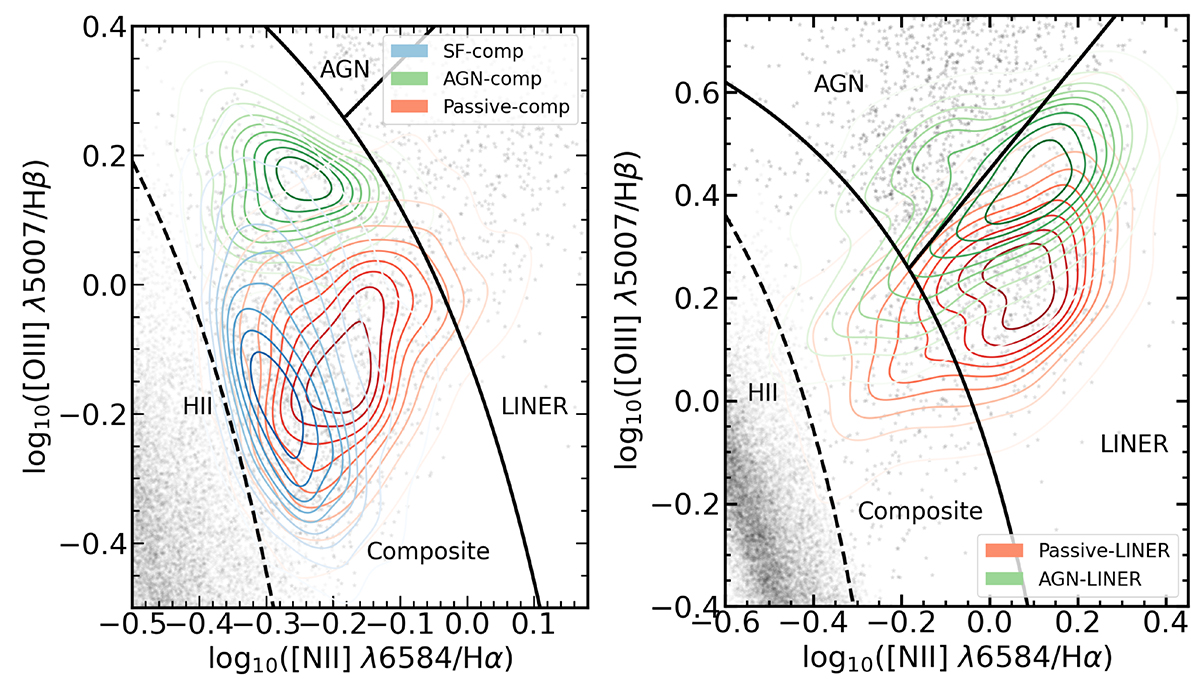
Fig. 6.
Download original image
Two BPT plots of log10([O III] λ5007/Hβ) vs. log10([N II] λ6584/Hα) displaying the outcome of the activity decomposition on spectroscopically selected sample of composite (left) and LINER (right) galaxies. Following the application of our diagnostic to these samples, we employed a color-coding scheme based on the highest likelihood of similarity to one of the principal activity classes. On the left, the blue contours represent composites predicted as SF (SF-composite), green as AGN (AGN-composite), and red as passive (passive-composite). This plot reveals the overlap of some SF and passive predicted composites. On the right, the green contours represent LINERs predicted to be AGN and red predicted to be passive. This plot shows that there is some overlap between the LINERs predicted as AGN and as passive. The black boundary lines are the same as defined in Fig. 2.
Current usage metrics show cumulative count of Article Views (full-text article views including HTML views, PDF and ePub downloads, according to the available data) and Abstracts Views on Vision4Press platform.
Data correspond to usage on the plateform after 2015. The current usage metrics is available 48-96 hours after online publication and is updated daily on week days.
Initial download of the metrics may take a while.