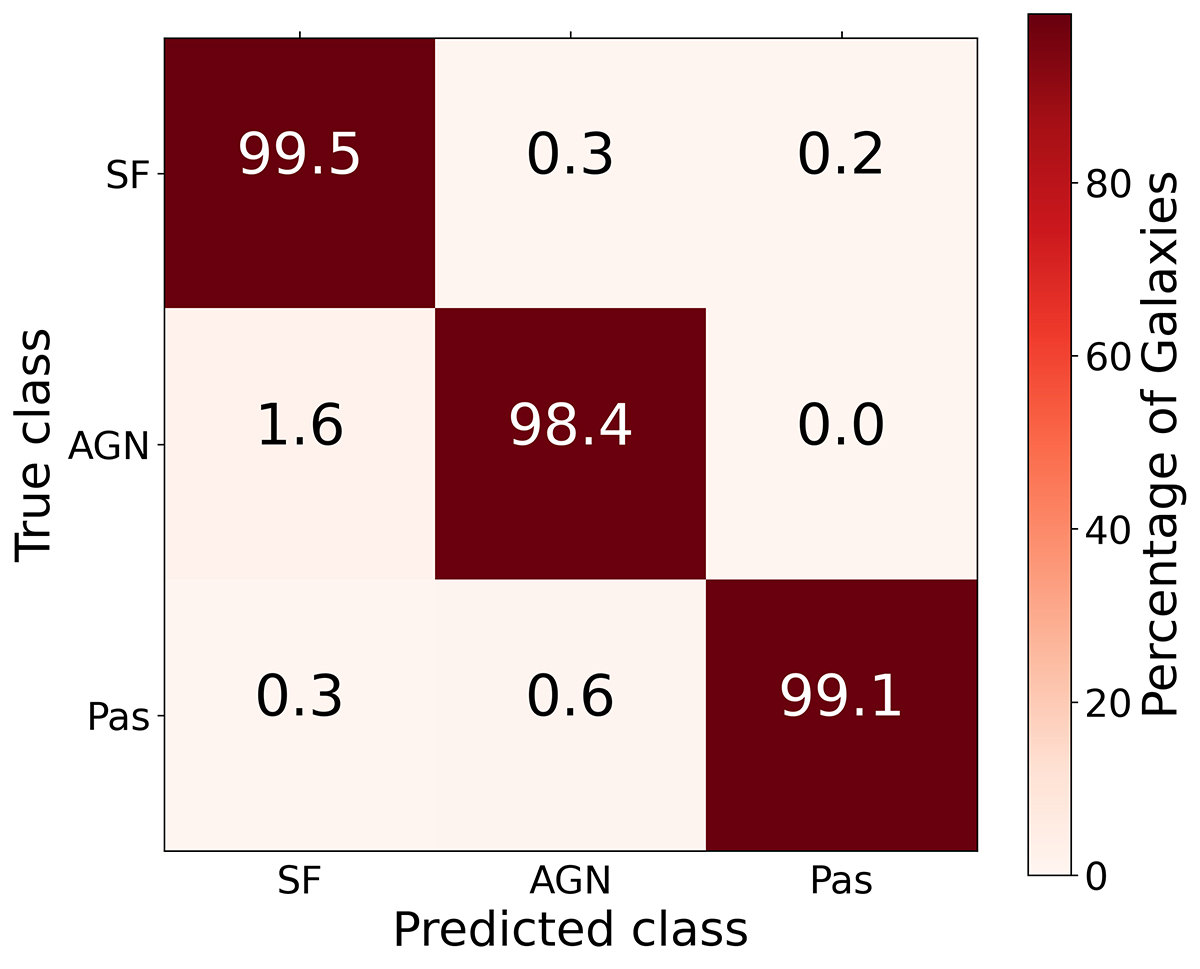
Fig. 4.
Download original image
Confusion matrix calculated on the test subset of the final sample. The color and the number in each box refer to the percentage of objects calculated relative to the total number of true instances for each class separately. The labels on the x- and y-axes indicate respectively the predicted and true class of a galaxy. We note that this matrix is almost diagonal, indicating a high-confidence classification.
Current usage metrics show cumulative count of Article Views (full-text article views including HTML views, PDF and ePub downloads, according to the available data) and Abstracts Views on Vision4Press platform.
Data correspond to usage on the plateform after 2015. The current usage metrics is available 48-96 hours after online publication and is updated daily on week days.
Initial download of the metrics may take a while.