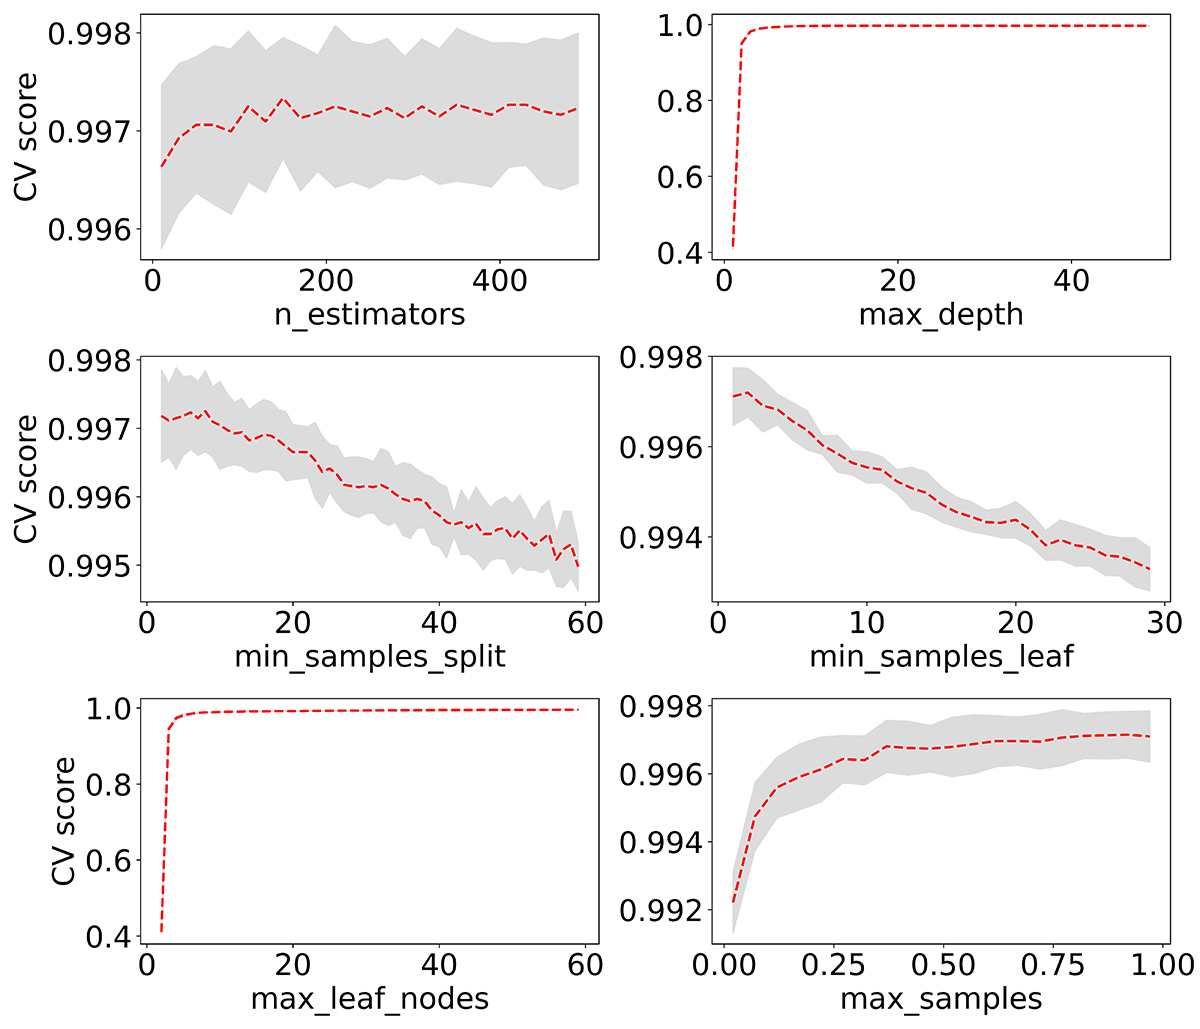
Fig. A.1.

Download original image
Accuracy scores (CV scores) vs all important random forest hyperparameters. CV scores have been computed through cross-validation, varying a single random forest hyperparameter while keeping all others constant. The red dashed line represents the average of these scores, and the gray shaded area indicates their standard deviation (1σ). By analyzing these curves, we can determine the range for each hyperparameter, which is crucial for reducing the number of hyperparameter combinations during the grid-search optimization procedure.
Current usage metrics show cumulative count of Article Views (full-text article views including HTML views, PDF and ePub downloads, according to the available data) and Abstracts Views on Vision4Press platform.
Data correspond to usage on the plateform after 2015. The current usage metrics is available 48-96 hours after online publication and is updated daily on week days.
Initial download of the metrics may take a while.


