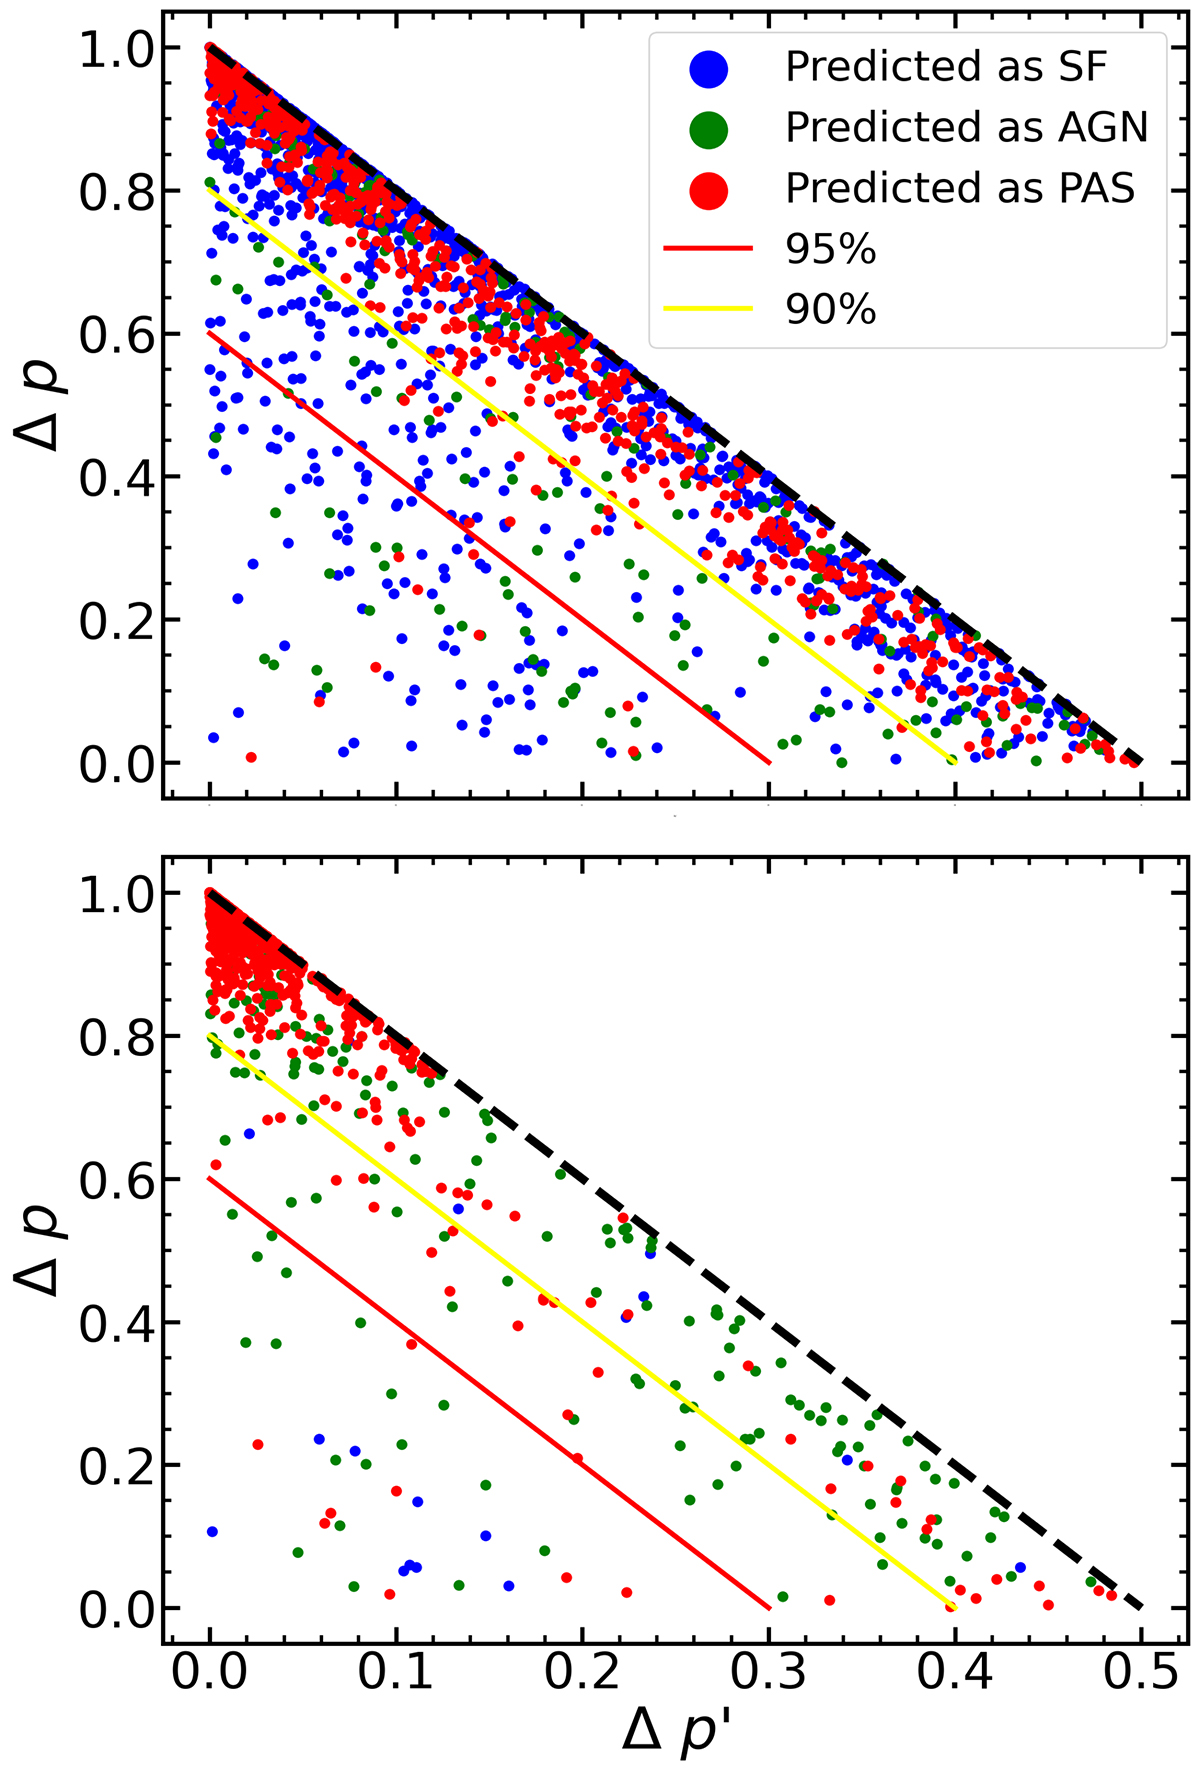
Fig. 15.
Download original image
Δp vs. Δp′. In both plots each dot represents a galaxy of mixed-activity class. The top plot is populated by the composite galaxies, while the bottom plot is populated by the LINER galaxies. In both plots we observe that the lower left corner contains objects with Δp = Δp′ = 0, indicating equal probabilities of belonging to all classes, resulting in unreliable classification. The black dashed line represents the extreme reliability line (Δp = −2 ⋅ Δp′+1). The region between the back line and the yellow solid line (Δp = −2 ⋅ Δp′+0.8) contains 90% of the mixed-class objects for both composites and LINERs, while the region between the black line and the solid red line (Δp = −2 ⋅ Δp′+0.6) encloses 95% of the mixed-class objects for both composites and LINERs.
Current usage metrics show cumulative count of Article Views (full-text article views including HTML views, PDF and ePub downloads, according to the available data) and Abstracts Views on Vision4Press platform.
Data correspond to usage on the plateform after 2015. The current usage metrics is available 48-96 hours after online publication and is updated daily on week days.
Initial download of the metrics may take a while.