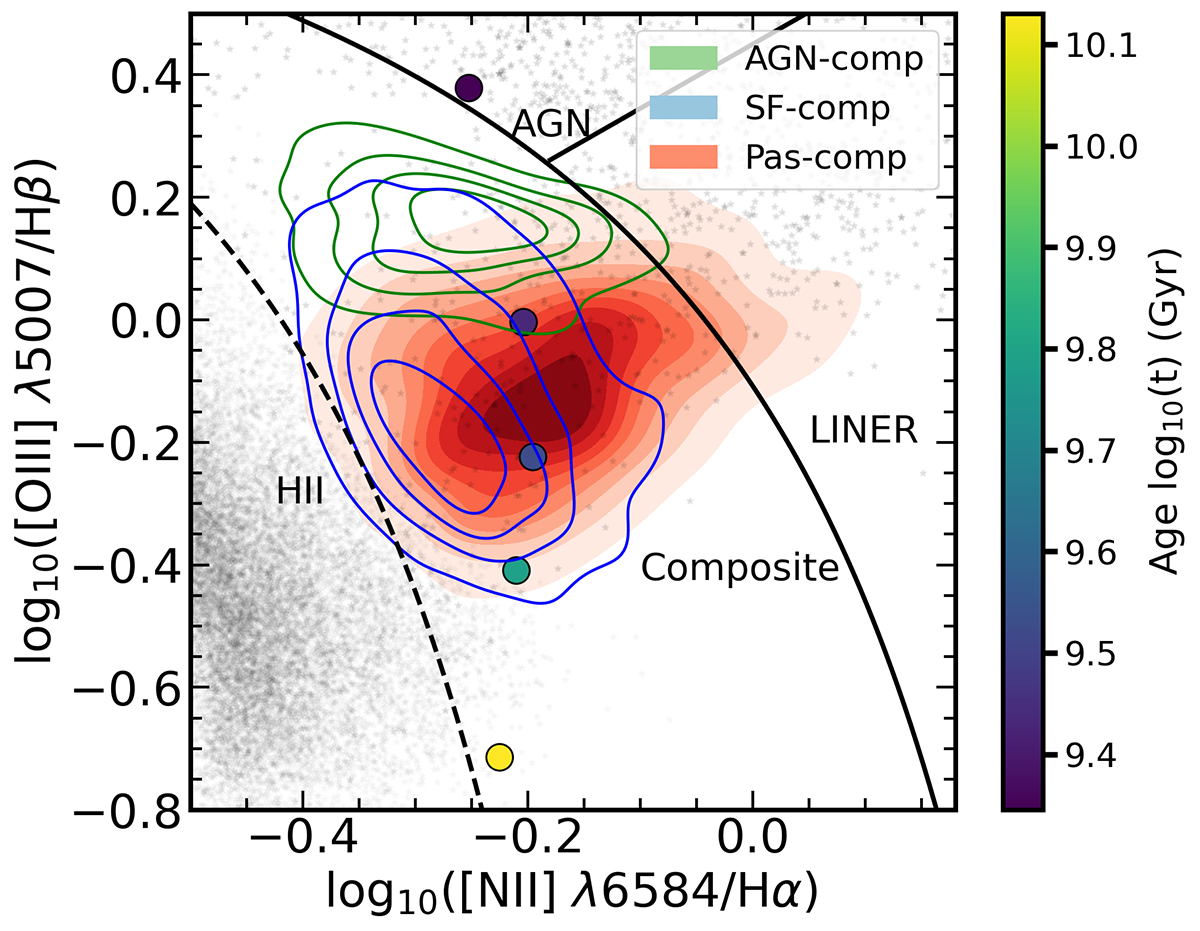
Fig. 13.
Download original image
Log10([O III]/Hβ) vs. log10([N II]/Hα). Within this plot we can see the distribution of the spectroscopically selected subsample of composite galaxies that have been classified by the new diagnostic as passive-composite galaxies, i.e., composites where the ionization source originates from hot evolved stars. The circular data points are derived from the photoionization models from the work of Byler et al. (2019), and they are overlaid to indicate the locations of galaxies with aging stellar populations spanning from 2 to 14 Gyr. The circles are color-coded to denote the age of the stellar populations. The black boundary lines are the same as defined in Fig. 2. The black dots in the top plot represent the training sample of the principal classes, included for illustrative purposes.
Current usage metrics show cumulative count of Article Views (full-text article views including HTML views, PDF and ePub downloads, according to the available data) and Abstracts Views on Vision4Press platform.
Data correspond to usage on the plateform after 2015. The current usage metrics is available 48-96 hours after online publication and is updated daily on week days.
Initial download of the metrics may take a while.