Fig. 12.
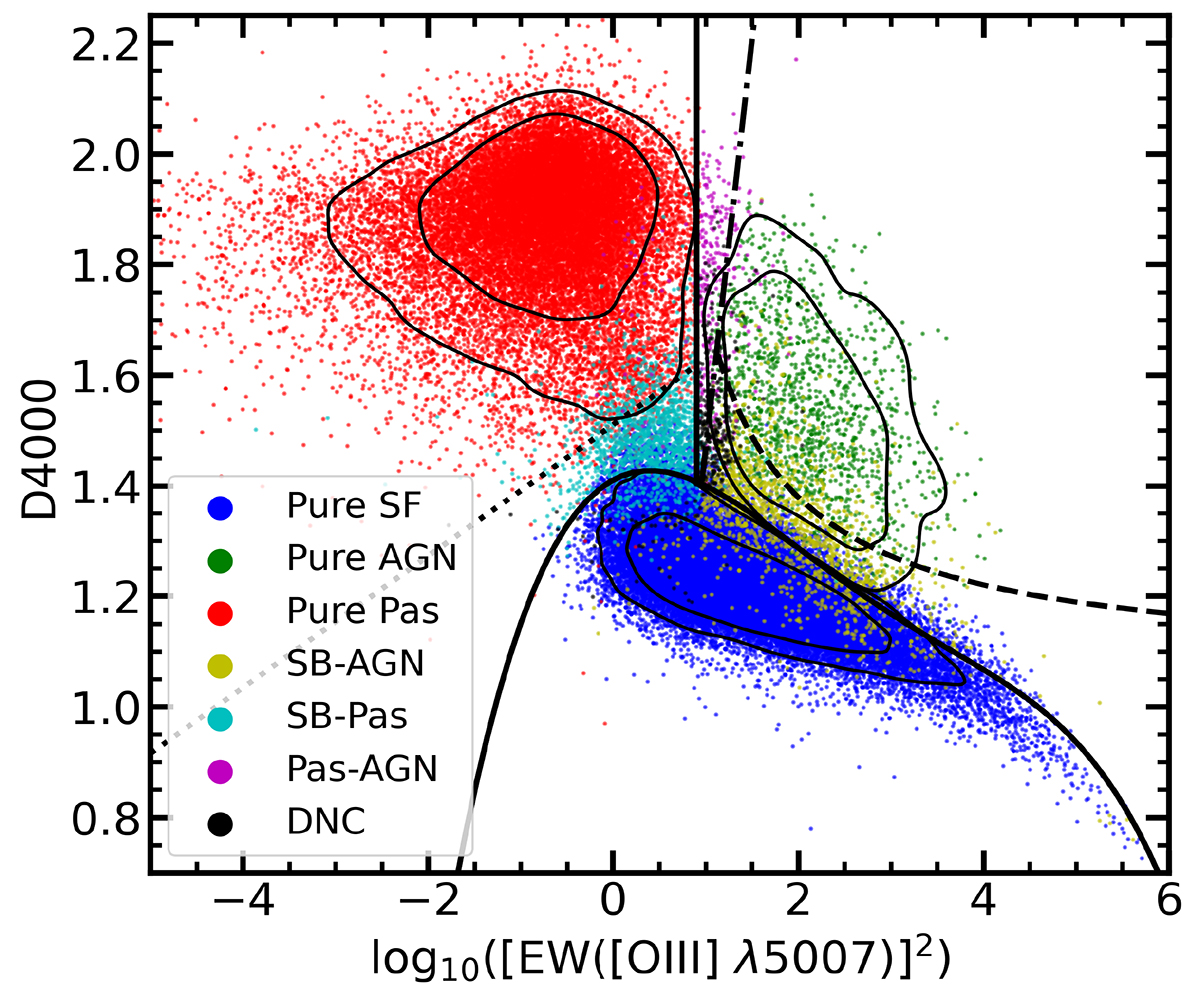
Download original image
Two-dimensional diagnostic diagram displaying the D4000 continuum break vs. log10(EW([O III])2), the DO3 diagnostic diagram. Within this plot we observe the spatial distribution of galaxies predominantly influenced by a single principal excitation mechanism (pure-activity classes), as well as the positions of those with mixed-activity classes. The black lines are the boundaries separating the different classes (see Sect. 4.6; for the equation of each boundary see Appendix B). The contours representing each pure-activity class are computed using a kernel density function and illustrate the 68% (inner contour) and 90% (outer contour) population density levels. Labels: pure SB (pure starburst), pure AGN (pure active galactic nucleus), pure Pas (pure passive).
Current usage metrics show cumulative count of Article Views (full-text article views including HTML views, PDF and ePub downloads, according to the available data) and Abstracts Views on Vision4Press platform.
Data correspond to usage on the plateform after 2015. The current usage metrics is available 48-96 hours after online publication and is updated daily on week days.
Initial download of the metrics may take a while.