Fig. 9
Download original image
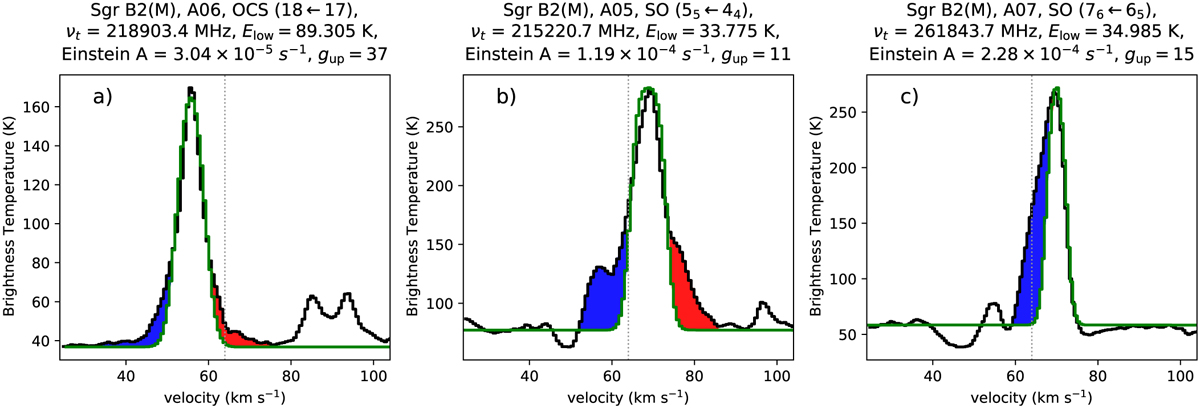
Example of transitions used to identify outflows toward Sgr B2(M) and N. The vertical dashed line marks the systemic velocity of the Sgr B2 complex and the high velocity wings are indicated in blue and red. The black line describes the observational data, while the green line represents a fit with a single Gaussian to emphasize the non-Gaussian wings of each peak. (a) Some transitions show more or less symmetric, non-Gaussian line shapes. (b) In addition, some transitions contain contributions from an isotopolog or another molecule. (c) There are also some transitions that show a strongly asymmetric line shape.
Current usage metrics show cumulative count of Article Views (full-text article views including HTML views, PDF and ePub downloads, according to the available data) and Abstracts Views on Vision4Press platform.
Data correspond to usage on the plateform after 2015. The current usage metrics is available 48-96 hours after online publication and is updated daily on week days.
Initial download of the metrics may take a while.