Fig. 8
Download original image
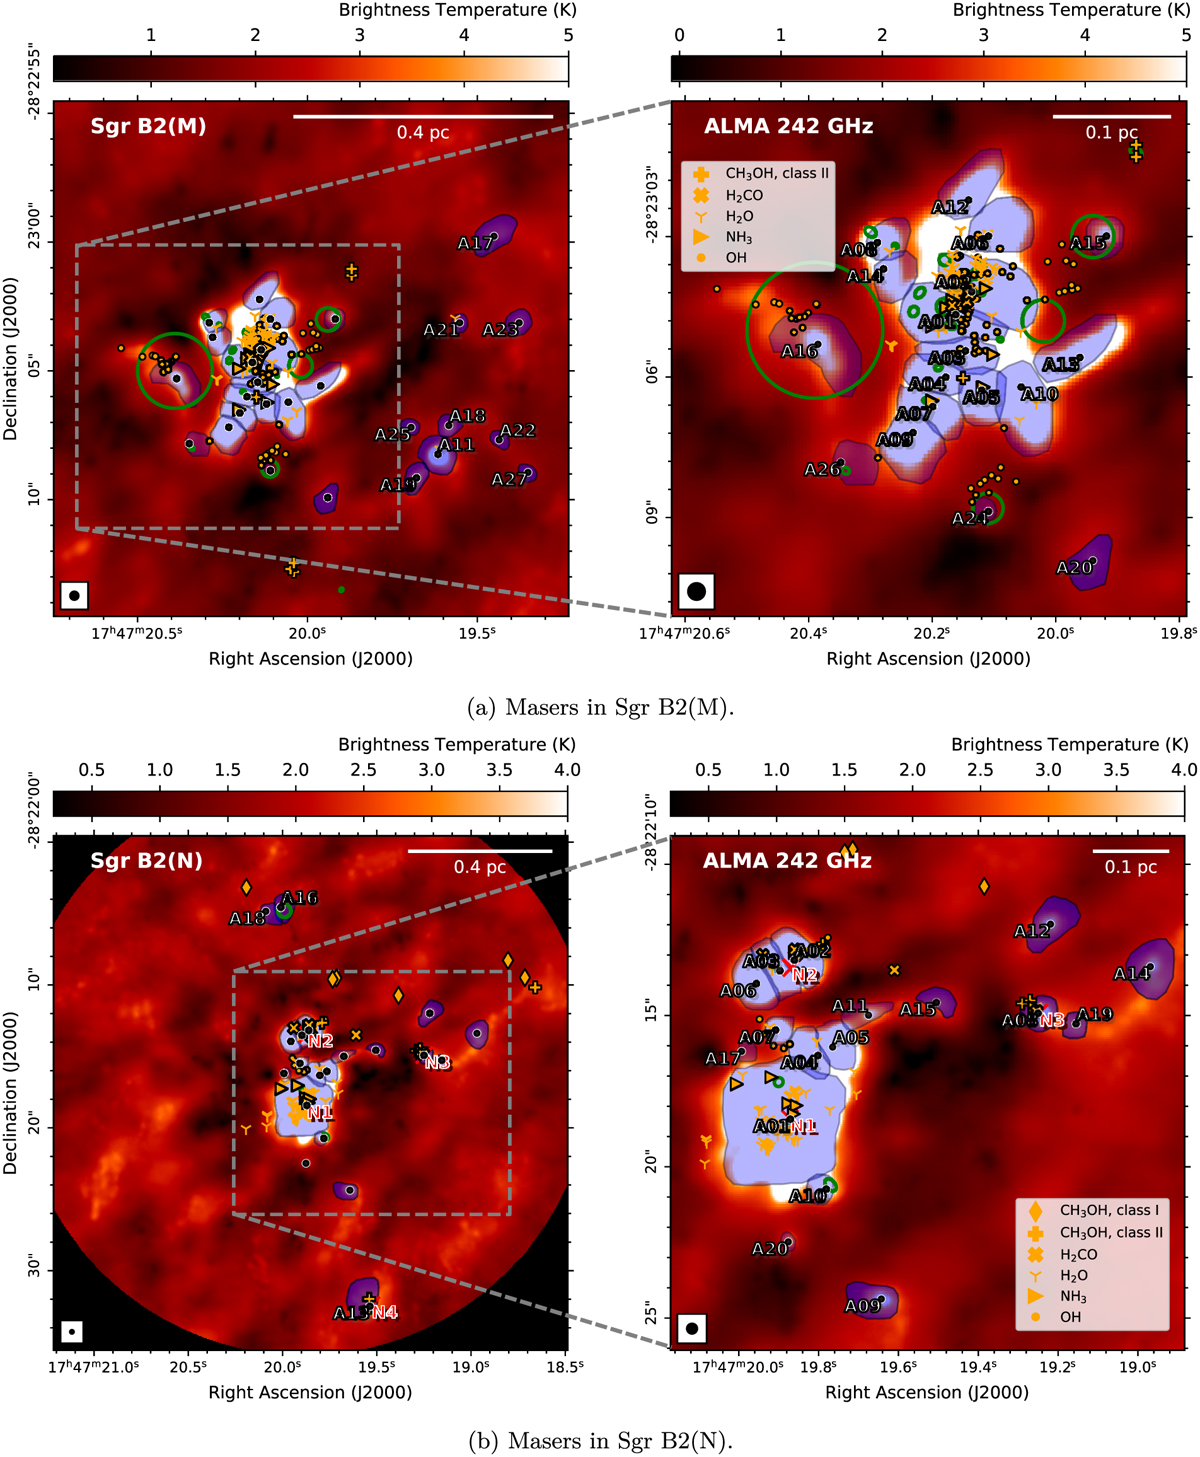
Sources in Sgr B2(M) and N together with the positions of the different masers. A close-up of the central part is presented in the right panel. The identified sources are marked with shaded blue polygons and indicated with the corresponding source ID. Similar to Figs. 1–2, the shaded light blue polygons describe the inner cores of the corresponding region. The black points indicate the positions of each source described by Sánchez-Monge et al. (2017). The intensity color scale is shown in units of brightness temperature and the synthesized beam of 0″.4 is described in the lower left corner. The green ellipses describe the H II regions identified by De Pree et al. (2015). The markers indicate the positions of published maser detections from the 44 GHz class I (Mehringer & Menten 1997) and from the 6.7 GHz class II methanol masers (Caswell 1996; Hu et al. 2016; Lu et al. 2019). Additionally, the positions from H2CO (Whiteoak et al. 1987; Mehringer et al. 1994; Lu et al. 2017), H2O (McGrath et al. 2004), NH3 (Martín-Pintado et al. 1999; Mills et al. 2018; Yan et al. 2022a), OH (Gaume & Claussen 1990; Yusef-Zadeh et al. 2016), and SiO (Morita et al. 1992; Shiki & Deguchi 1997; Zapata et al. 2009) masers are described as well. The red crosses and names indicate the hot cores in Sgr B2(N) identified by Bonfand et al. (2017).
Current usage metrics show cumulative count of Article Views (full-text article views including HTML views, PDF and ePub downloads, according to the available data) and Abstracts Views on Vision4Press platform.
Data correspond to usage on the plateform after 2015. The current usage metrics is available 48-96 hours after online publication and is updated daily on week days.
Initial download of the metrics may take a while.