Fig. 1
Download original image
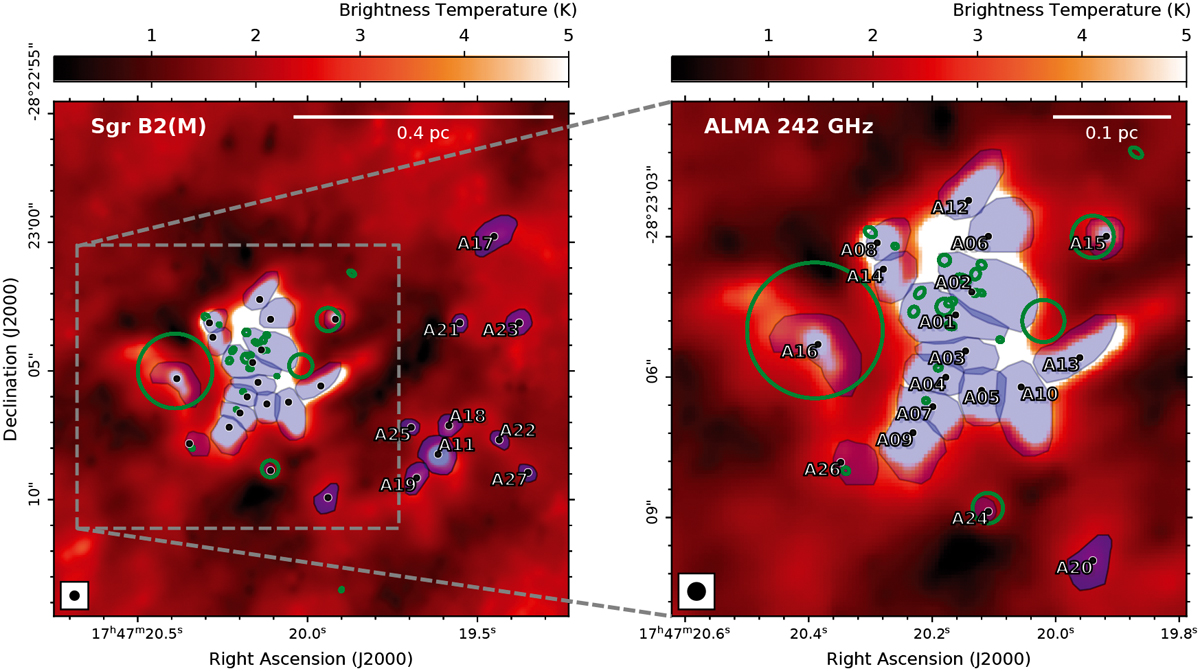
Partly taken from Möller et al. (2023). Continuum emission toward Sgr B2(M) at 242 GHz. A close-up of the central part is presented in the right panel. The identified sources are marked with shaded blue polygons and indicated with the corresponding source ID. The shaded light blue polygons describe the inner cores. The black points indicate the position of each core, described by Sánchez-Monge et al. (2017). The intensity color scale is shown in units of brightness temperature, and the synthesized beam of 0″.4 is described in the lower left corner. The green ellipses describe the H II regions identified by De Pree et al. (2015), where the size of each ellipse indicates to the size of the corresponding H II region.
Current usage metrics show cumulative count of Article Views (full-text article views including HTML views, PDF and ePub downloads, according to the available data) and Abstracts Views on Vision4Press platform.
Data correspond to usage on the plateform after 2015. The current usage metrics is available 48-96 hours after online publication and is updated daily on week days.
Initial download of the metrics may take a while.