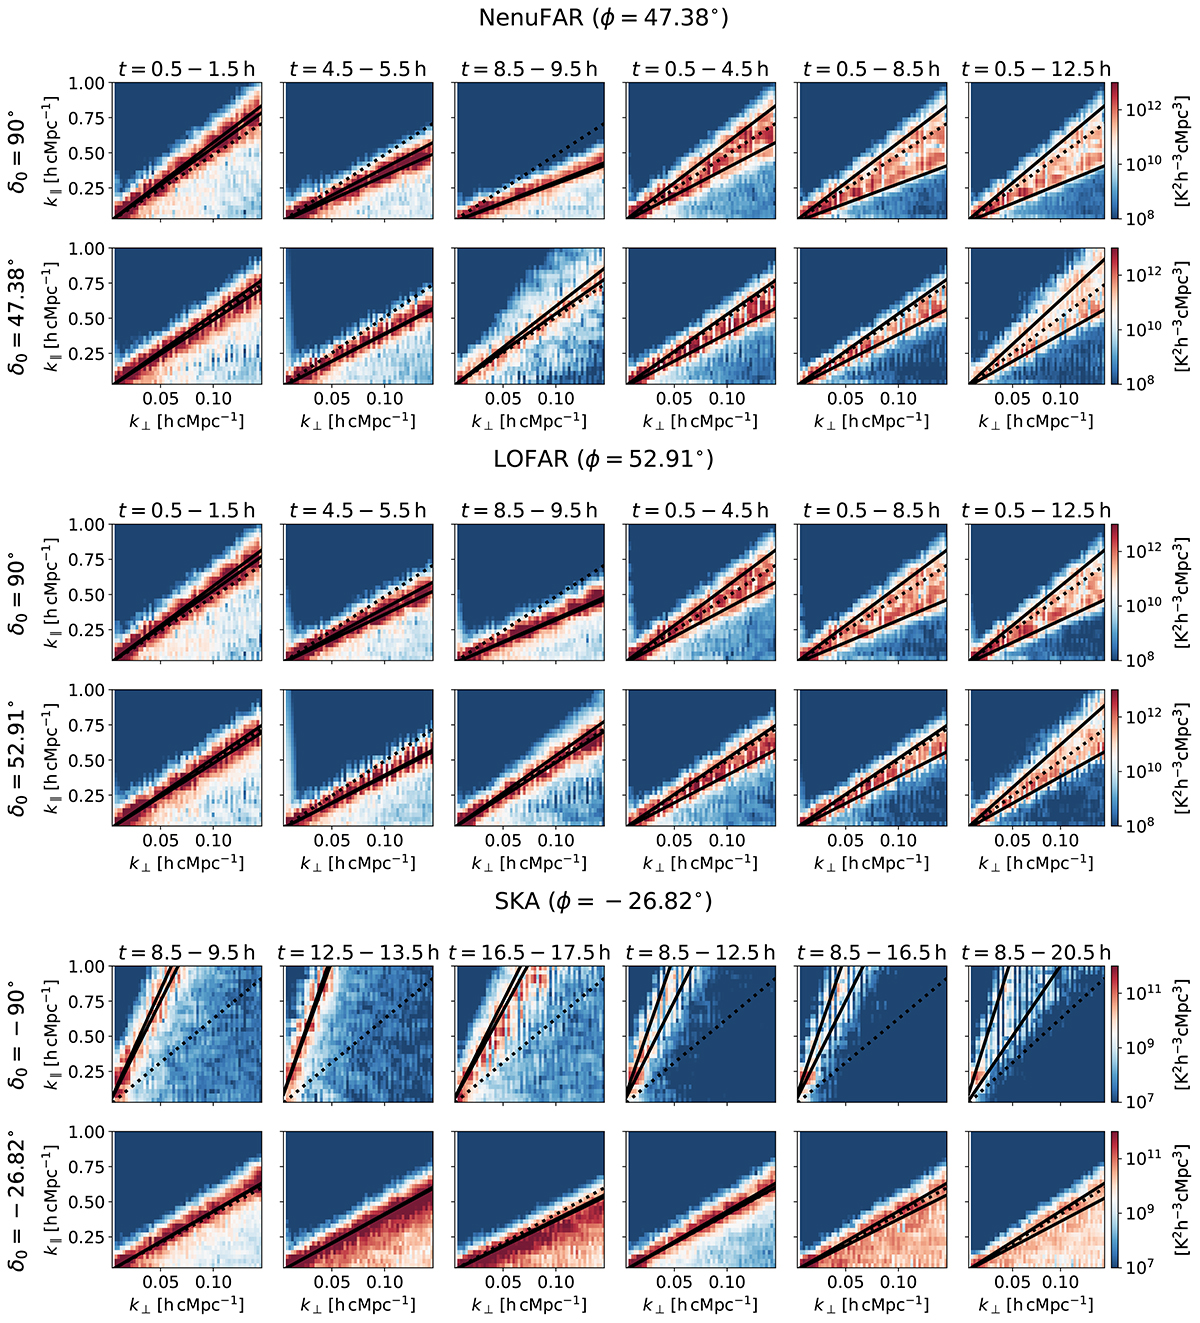
Fig. 8.
Download original image
Cylindrical power spectra for Cyg A simulations at the locations of NenuFAR and LOFAR, and Vir A simulations at the location of SKA. For each location, the two rows correspond to two phase center declinations (δ0) of the celestial pole (upper row) and zenith transit (lower row). The different columns correspond to the different LST ranges for which the simulations were repeated. The dotted line is the conventional source line. The black solid lines correspond to the maximum and minimum source lines for the observation duration, obtained from the source line equation derived in this analysis (Eq. (22)). The remaining Cas A and Cen A simulation results are shown in Fig. E.2.
Current usage metrics show cumulative count of Article Views (full-text article views including HTML views, PDF and ePub downloads, according to the available data) and Abstracts Views on Vision4Press platform.
Data correspond to usage on the plateform after 2015. The current usage metrics is available 48-96 hours after online publication and is updated daily on week days.
Initial download of the metrics may take a while.