Fig. 7.
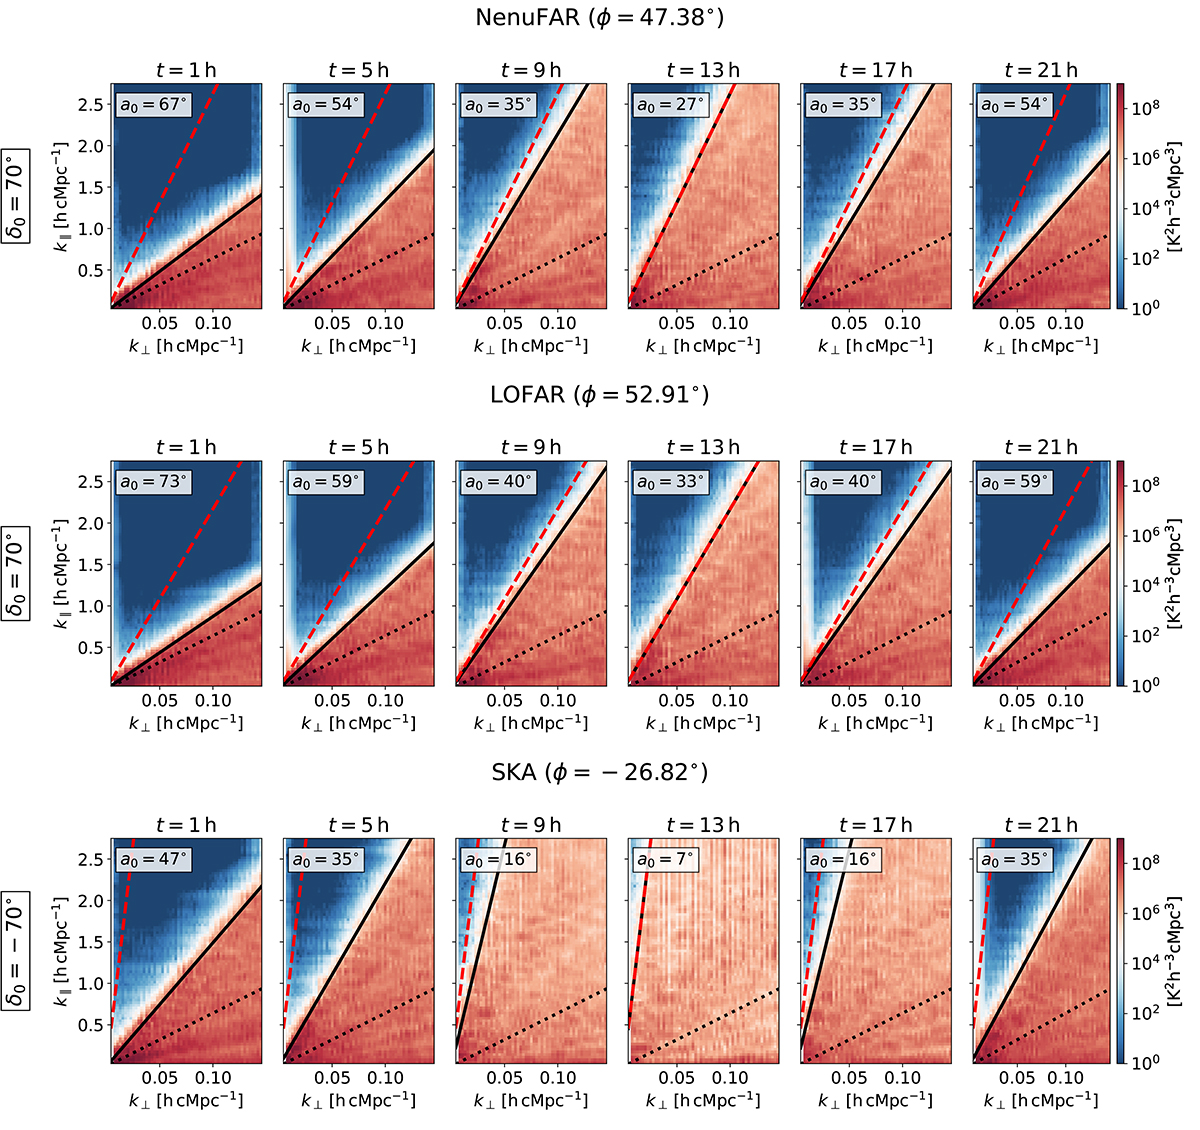
Download original image
Cylindrical power spectra for full-sky simulations with the array placed at the locations of NenuFAR, LOFAR, and SKA corresponding to a phase center declination of 70° (−70° for SKA). The different columns correspond to different LSTs at which the 1 h simulations are centered. The dotted line is the conventional horizon line. The black solid line is the LST-dependent horizon line (Eq. (14)). The red dashed line is the horizon line for full synthesis (Eq. (15)). a0 is the altitude of the phase center at the LST at which the simulation is centered. The results of the remaining simulations for the celestial pole and zenith transit phase centers are shown in Fig. E.1.
Current usage metrics show cumulative count of Article Views (full-text article views including HTML views, PDF and ePub downloads, according to the available data) and Abstracts Views on Vision4Press platform.
Data correspond to usage on the plateform after 2015. The current usage metrics is available 48-96 hours after online publication and is updated daily on week days.
Initial download of the metrics may take a while.