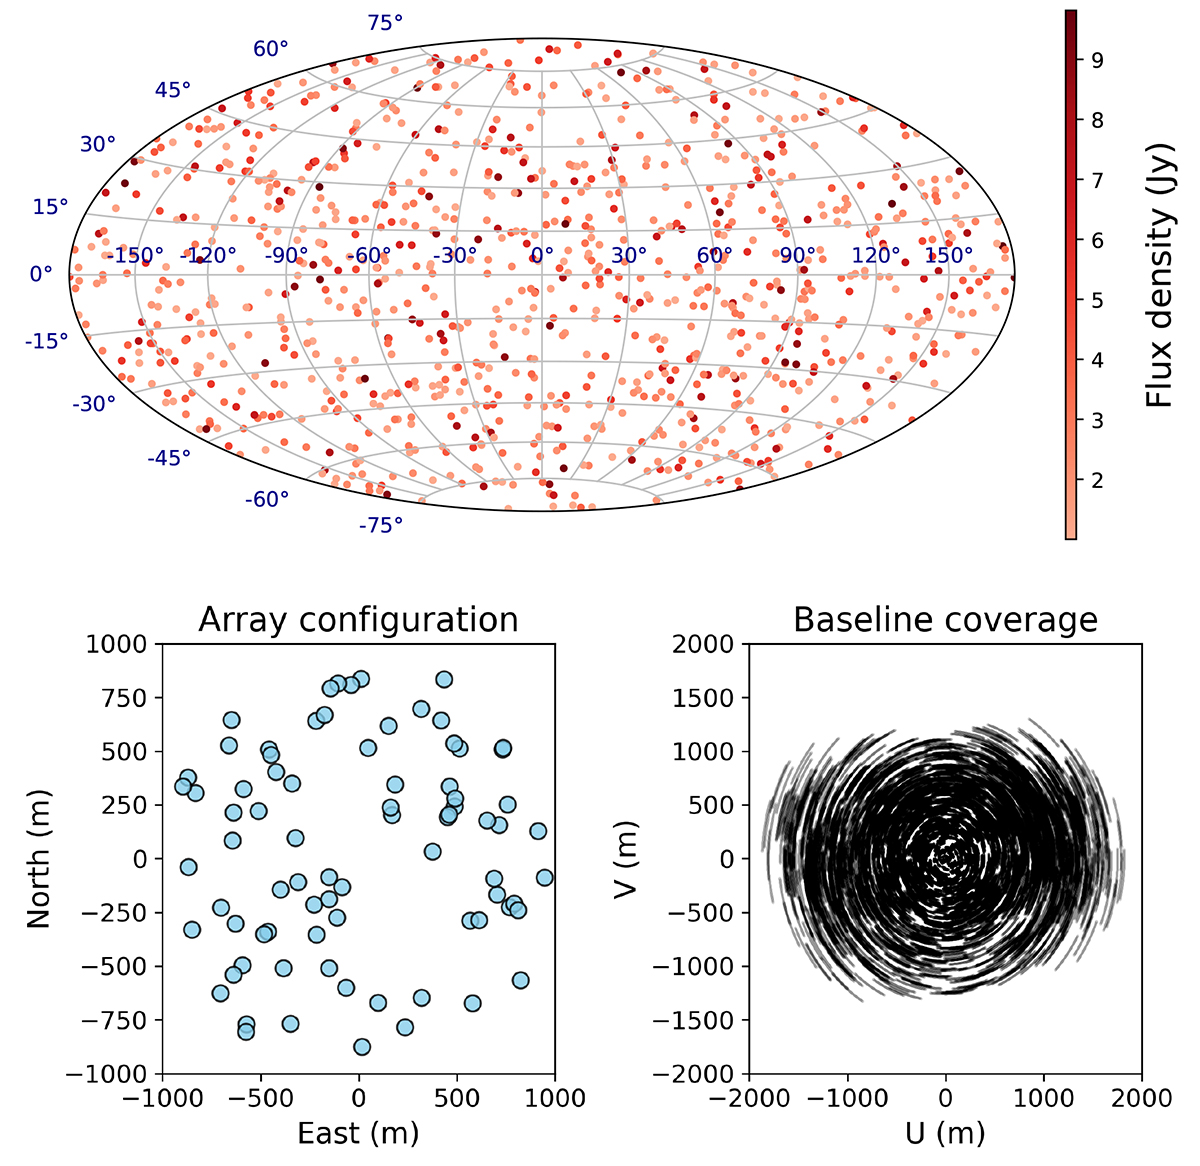
Fig. 6.
Download original image
Inputs to the simulations used for validating the derived equations. Top: sky model used in the simulations performed for validating the horizon line equations. Bottom left: Local array configuration. Bottom right: example baseline coverage for a 1 h simulation with NCP phasing with the array placed at the location of NenuFAR.
Current usage metrics show cumulative count of Article Views (full-text article views including HTML views, PDF and ePub downloads, according to the available data) and Abstracts Views on Vision4Press platform.
Data correspond to usage on the plateform after 2015. The current usage metrics is available 48-96 hours after online publication and is updated daily on week days.
Initial download of the metrics may take a while.