Fig. 3.
Download original image
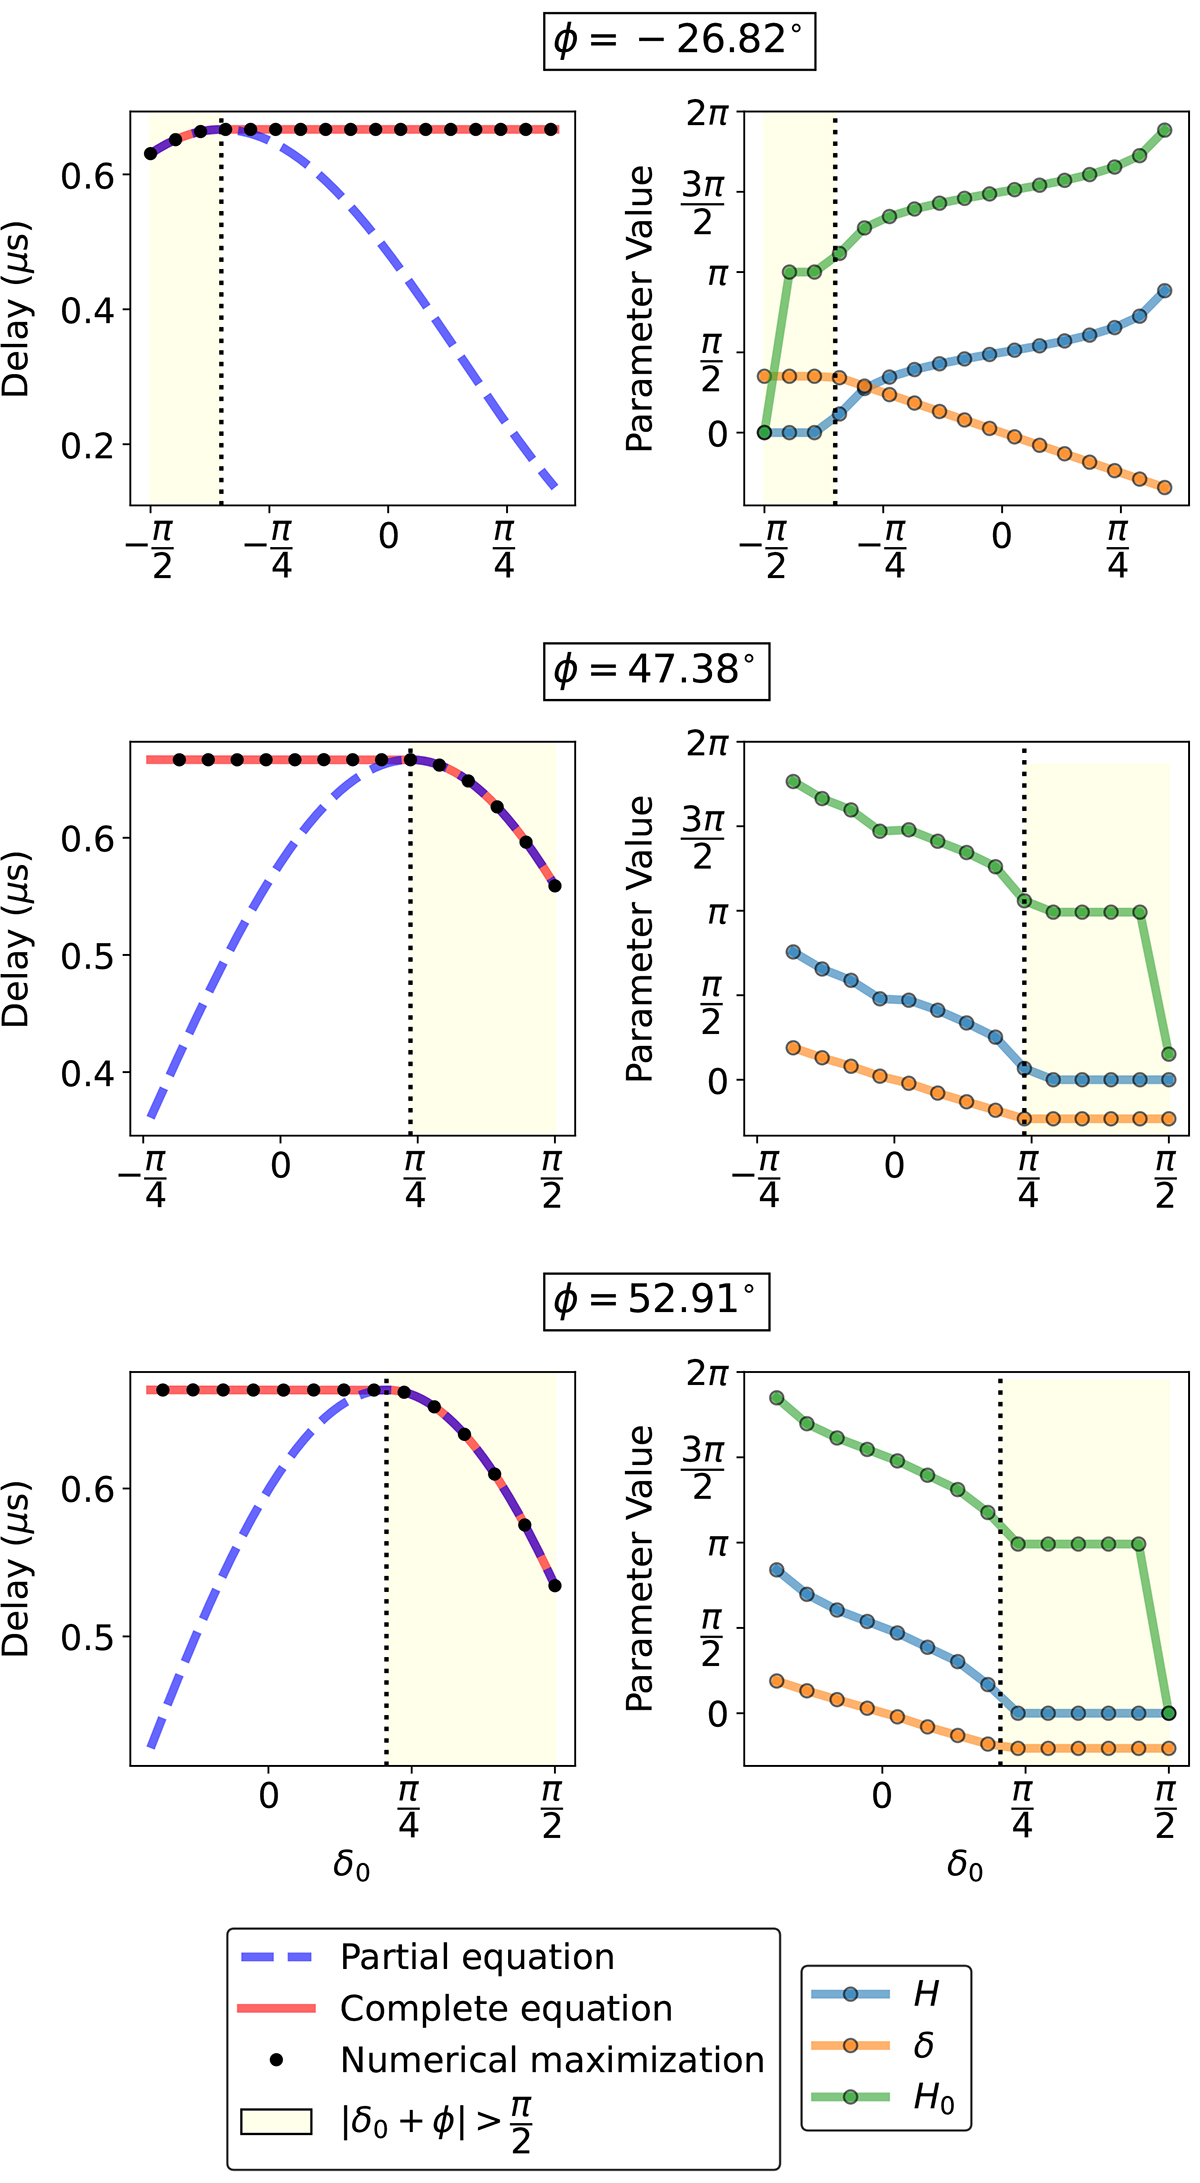
Maximum delay in visibilities measured by a 100 m baseline, for a given phase center declination, assuming a full synthesis. Left: maximum delay as a function of declination of the phase center δ0, obtained by numerical maximization of Eq. (5) over H, δ, H0, θ (black dots), the maximum delays predicted by the partial equation (Eq. (7): blue dashed line) and those predicted by the full equation (Eq. (8): red solid line). Right: values of H, δ, and H0 at the maximum. The vertical dotted lines separate regimes where |δ0 + ϕ|≤π/2 and |δ0 + ϕ|> π/2.
Current usage metrics show cumulative count of Article Views (full-text article views including HTML views, PDF and ePub downloads, according to the available data) and Abstracts Views on Vision4Press platform.
Data correspond to usage on the plateform after 2015. The current usage metrics is available 48-96 hours after online publication and is updated daily on week days.
Initial download of the metrics may take a while.