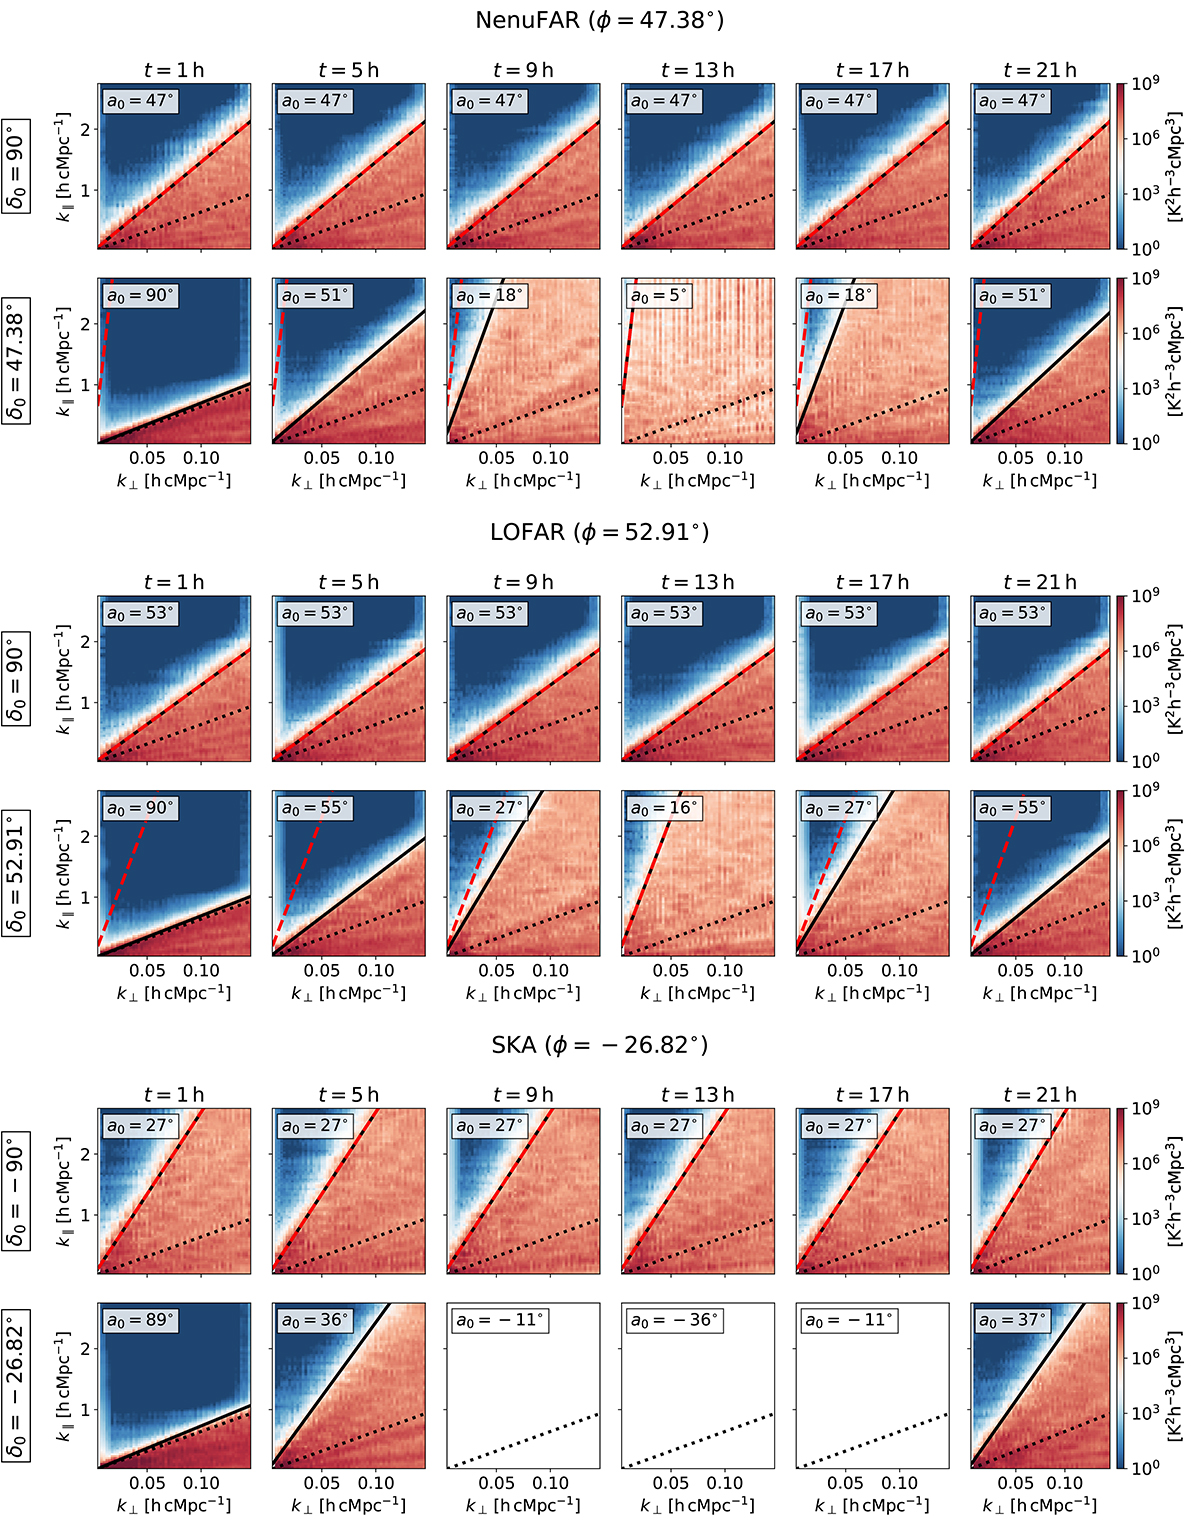
Fig. E.1.
Download original image
Cylindrical power spectra for the remaining full-sky simulations that were not shown in Fig. 7. For each location, the two rows correspond to the celestial pole (top) and zenith transit (bottom) phase center declinations. In the lowermost row, for the simulations centered at LST = 9h, 13h, and 17h, the phase center is below the horizon for part of the observation, and hence the visibilities are not predicted. The full synthesis line is not shown in this case since it is vertical (from Eq. (15)).
Current usage metrics show cumulative count of Article Views (full-text article views including HTML views, PDF and ePub downloads, according to the available data) and Abstracts Views on Vision4Press platform.
Data correspond to usage on the plateform after 2015. The current usage metrics is available 48-96 hours after online publication and is updated daily on week days.
Initial download of the metrics may take a while.