Open Access
Fig. D.1.
Download original image
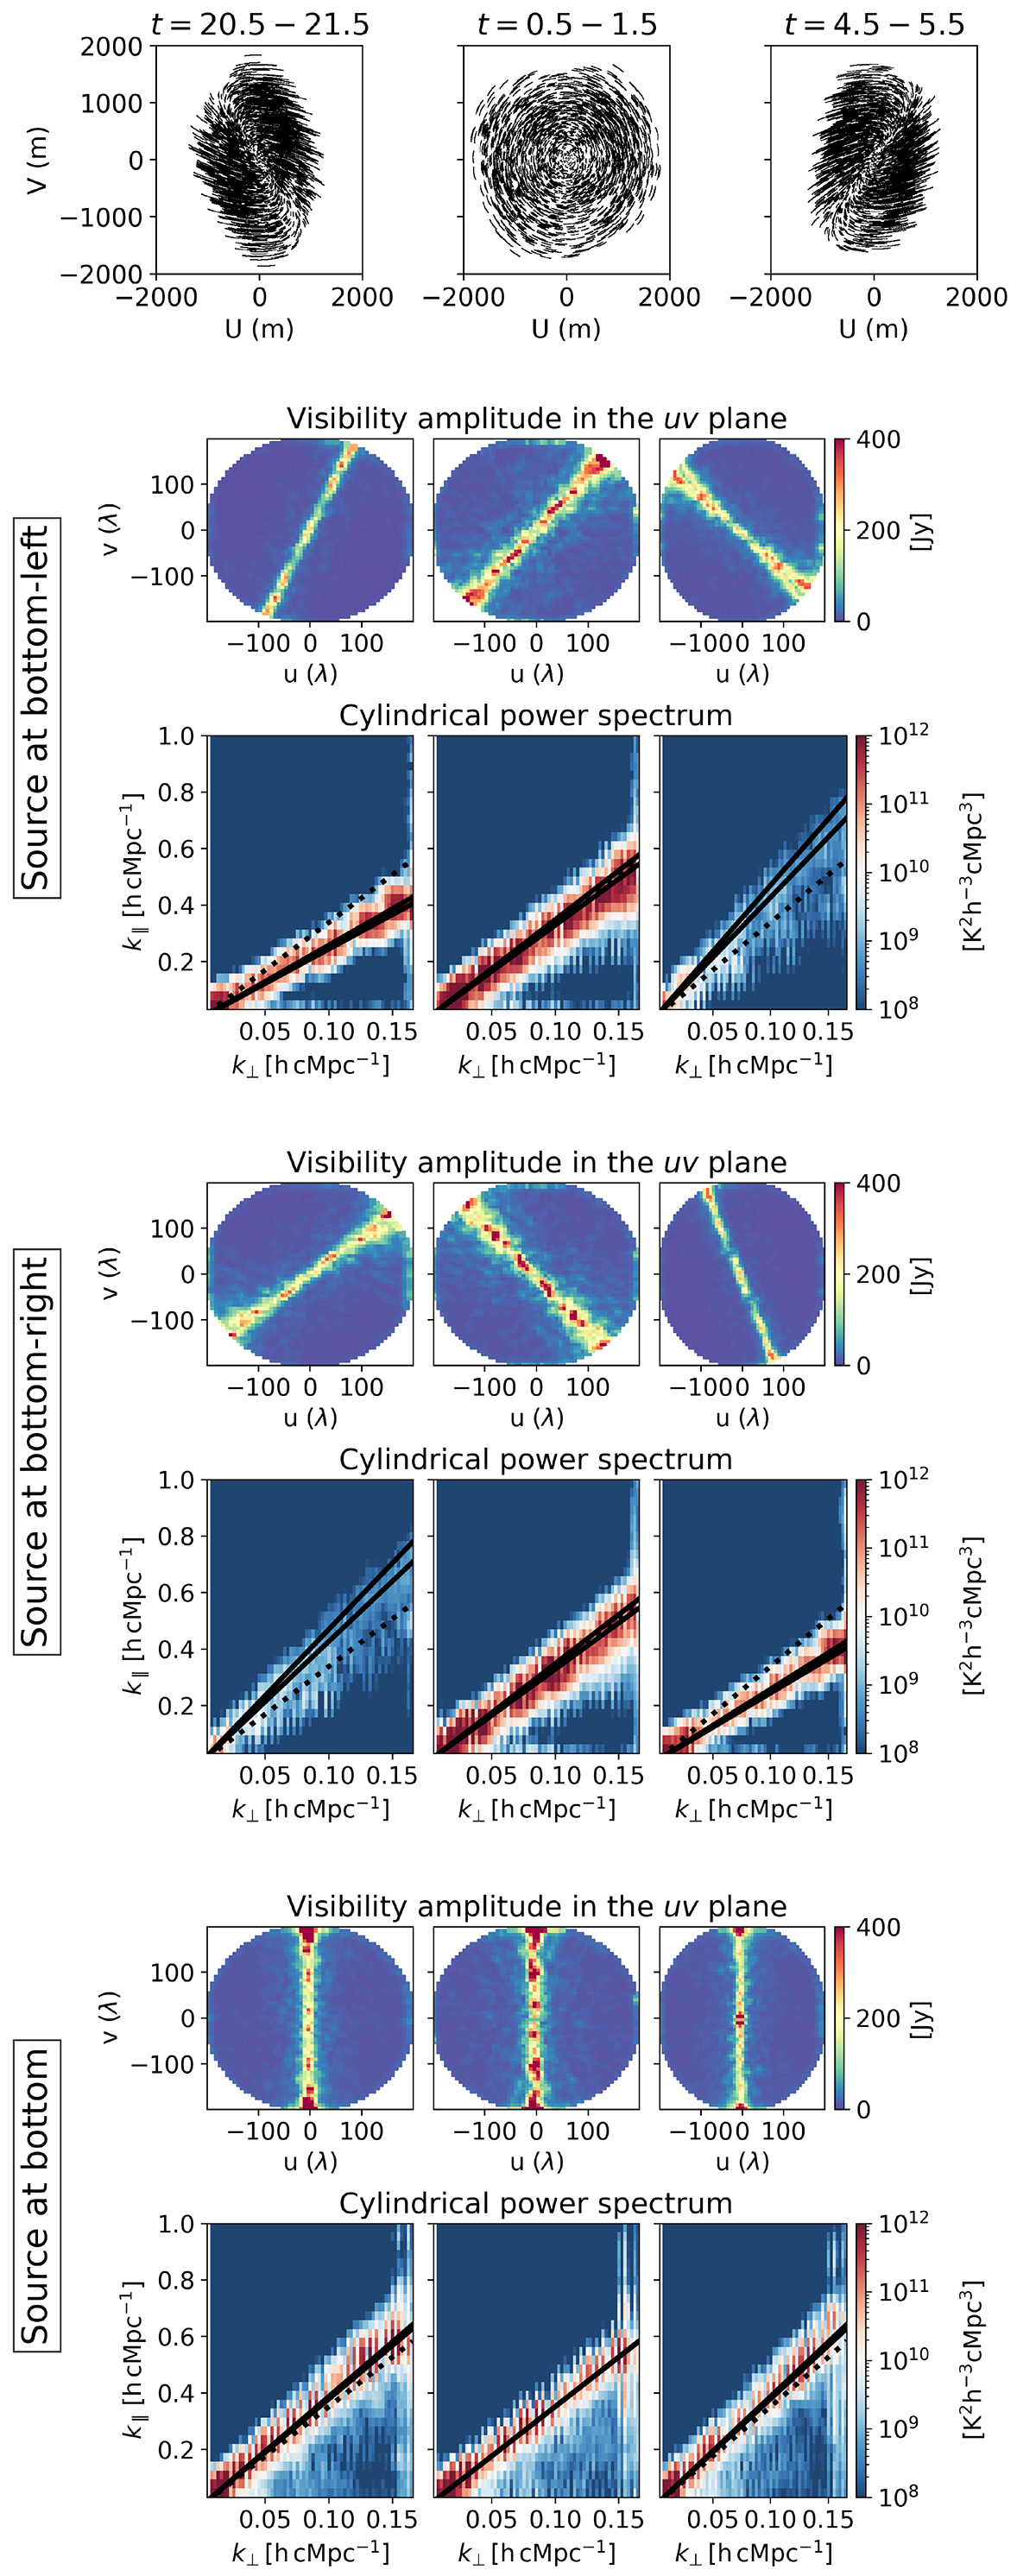
Impact of uv coverage on source lines. The top row shows the baseline coverages for the three LST ranges for which the simulations are repeated. The other rows show the visibility amplitude in the uv plane and the cylindrical power spectra, for a source located at the bottom left, bottom right, and bottom of the image.
Current usage metrics show cumulative count of Article Views (full-text article views including HTML views, PDF and ePub downloads, according to the available data) and Abstracts Views on Vision4Press platform.
Data correspond to usage on the plateform after 2015. The current usage metrics is available 48-96 hours after online publication and is updated daily on week days.
Initial download of the metrics may take a while.