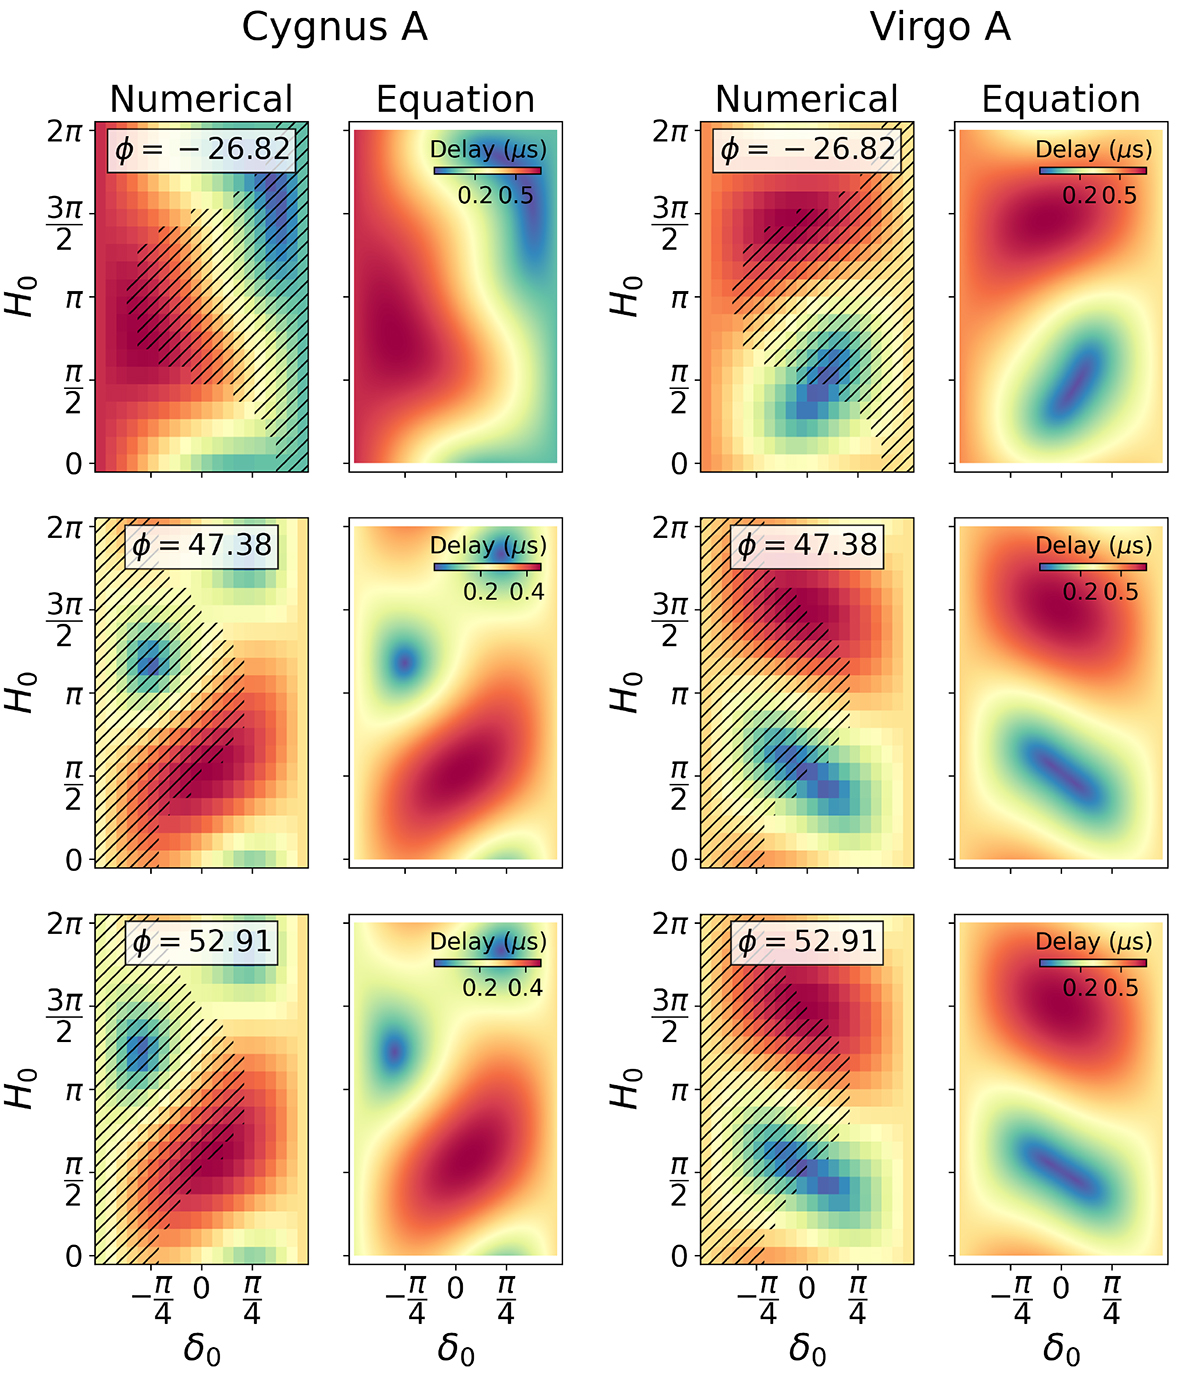
Fig. C.1.
Download original image
Comparison between the delay due to a source obtained by numerical maximization of Eq. (5), against that expected from Eq. (18). The delays due to Cyg A (left two columns) and Vir A (right two columns) for three different latitudes (different rows) are shown. The columns titled “Numerical” correspond to delay values obtained by numerically maximizing Eq. (5) over θ. The columns titled “Equation” correspond to the delay values for the baseline responsible for maximum power as predicted by Eq. (18). The slanted stripes indicate regions where the phase center is below the physical horizon.
Current usage metrics show cumulative count of Article Views (full-text article views including HTML views, PDF and ePub downloads, according to the available data) and Abstracts Views on Vision4Press platform.
Data correspond to usage on the plateform after 2015. The current usage metrics is available 48-96 hours after online publication and is updated daily on week days.
Initial download of the metrics may take a while.