Fig. 1.
Download original image
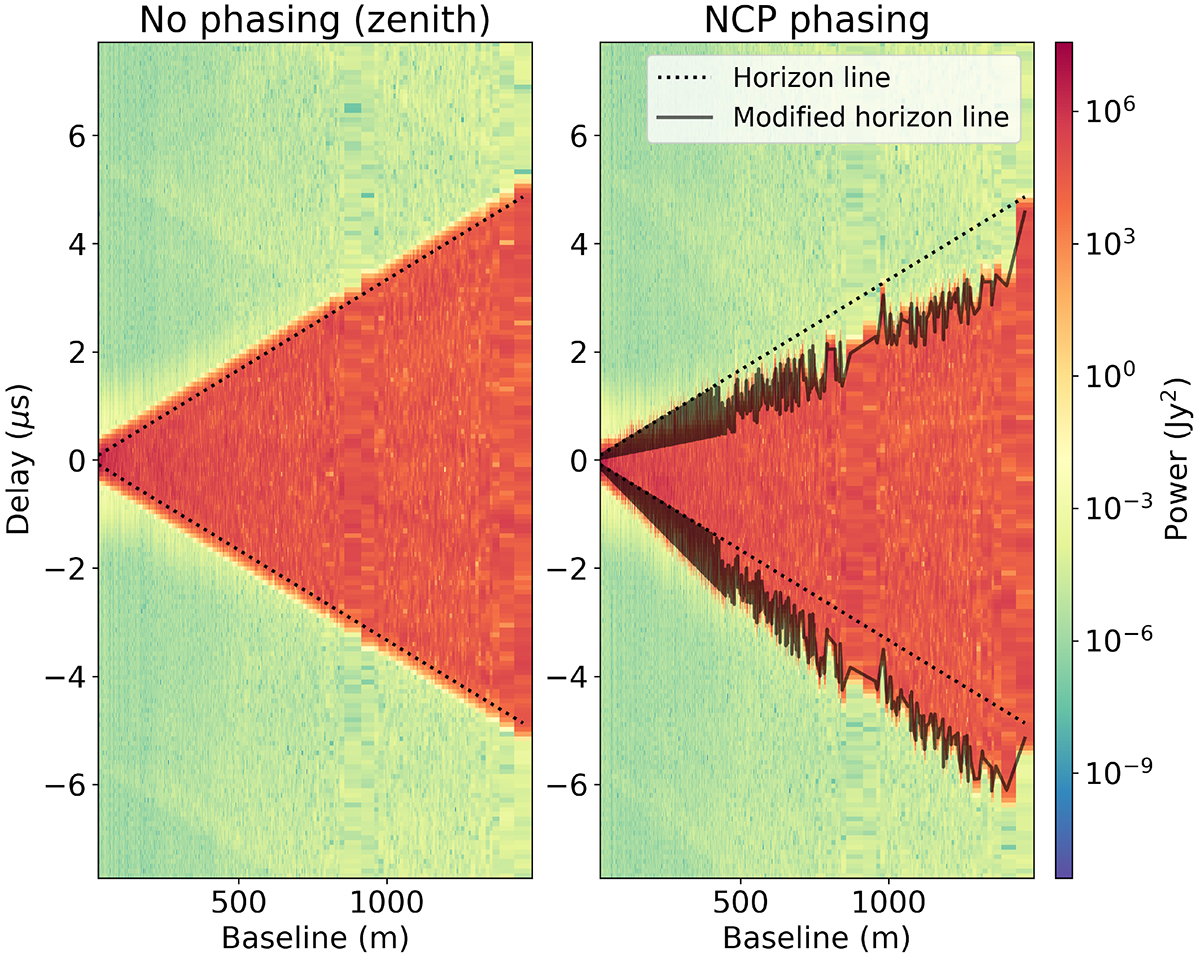
Effect of geometric phasing on the delay power spectrum. The two panels show the delay power spectra before (left) and after (right) phasing to the NCP for a full-sky simulation with NenuFAR. The dotted lines correspond to the standard horizon limit of Eq. (1), and the solid lines correspond to the extended horizon due to phasing from Eq. (4).
Current usage metrics show cumulative count of Article Views (full-text article views including HTML views, PDF and ePub downloads, according to the available data) and Abstracts Views on Vision4Press platform.
Data correspond to usage on the plateform after 2015. The current usage metrics is available 48-96 hours after online publication and is updated daily on week days.
Initial download of the metrics may take a while.