Fig. 6.
Download original image
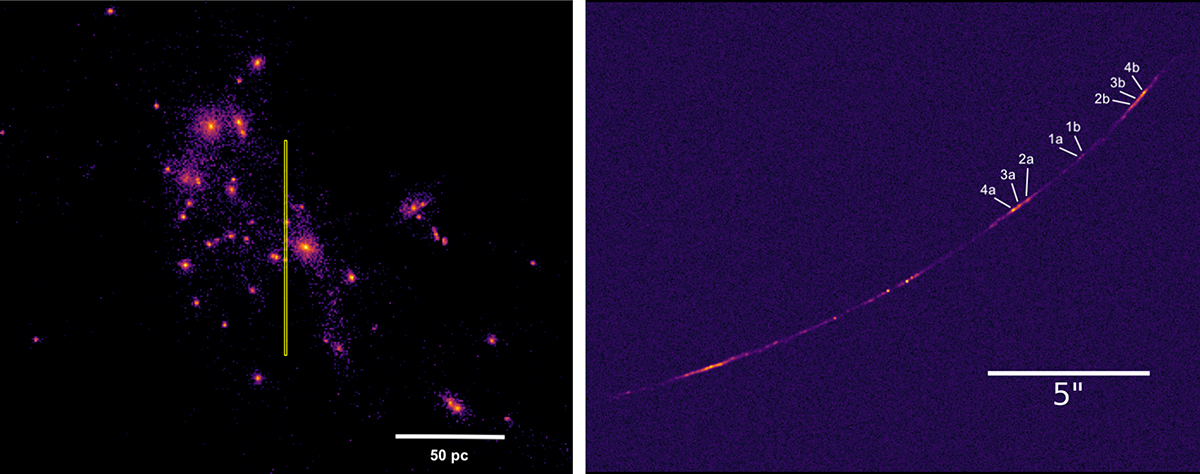
Left: Snapshot of a simulated high-z galaxy from Garcia et al. (2023) (HSFE run). In this simulation, the high star formation efficiency (HSFE) in its star-forming gas clouds, which have densities ∼100× that of Milky Way’s molecular clouds, leads to the formation of numerous compact (radii of ∼1 − 2 pc) and gravitationally bound star clusters. Here the color coding shows the density of stars and the yellow rectangle of size 1 × 100 pc represents a sketch of a ray-traced JWST pixel next to the critical curve (line of infinite magnification) traced from the image plane to the source plane (left). The location of the galaxy with respect to the yellow rectangle (arbitrarily chosen in this figure) is randomized in order to assess the magnification probability of N star clusters. Right: Lensed image of the galaxy shown on the left panel, placed at z = 6 across the caustic of the cluster WHL0137-08, using the GLAFIC lensing model reproducing the Sunrise Arc/Earendel. We labeled only the clumps that are mirror images around the location of Earendel. See the text for the details of how the image was produced.
Current usage metrics show cumulative count of Article Views (full-text article views including HTML views, PDF and ePub downloads, according to the available data) and Abstracts Views on Vision4Press platform.
Data correspond to usage on the plateform after 2015. The current usage metrics is available 48-96 hours after online publication and is updated daily on week days.
Initial download of the metrics may take a while.