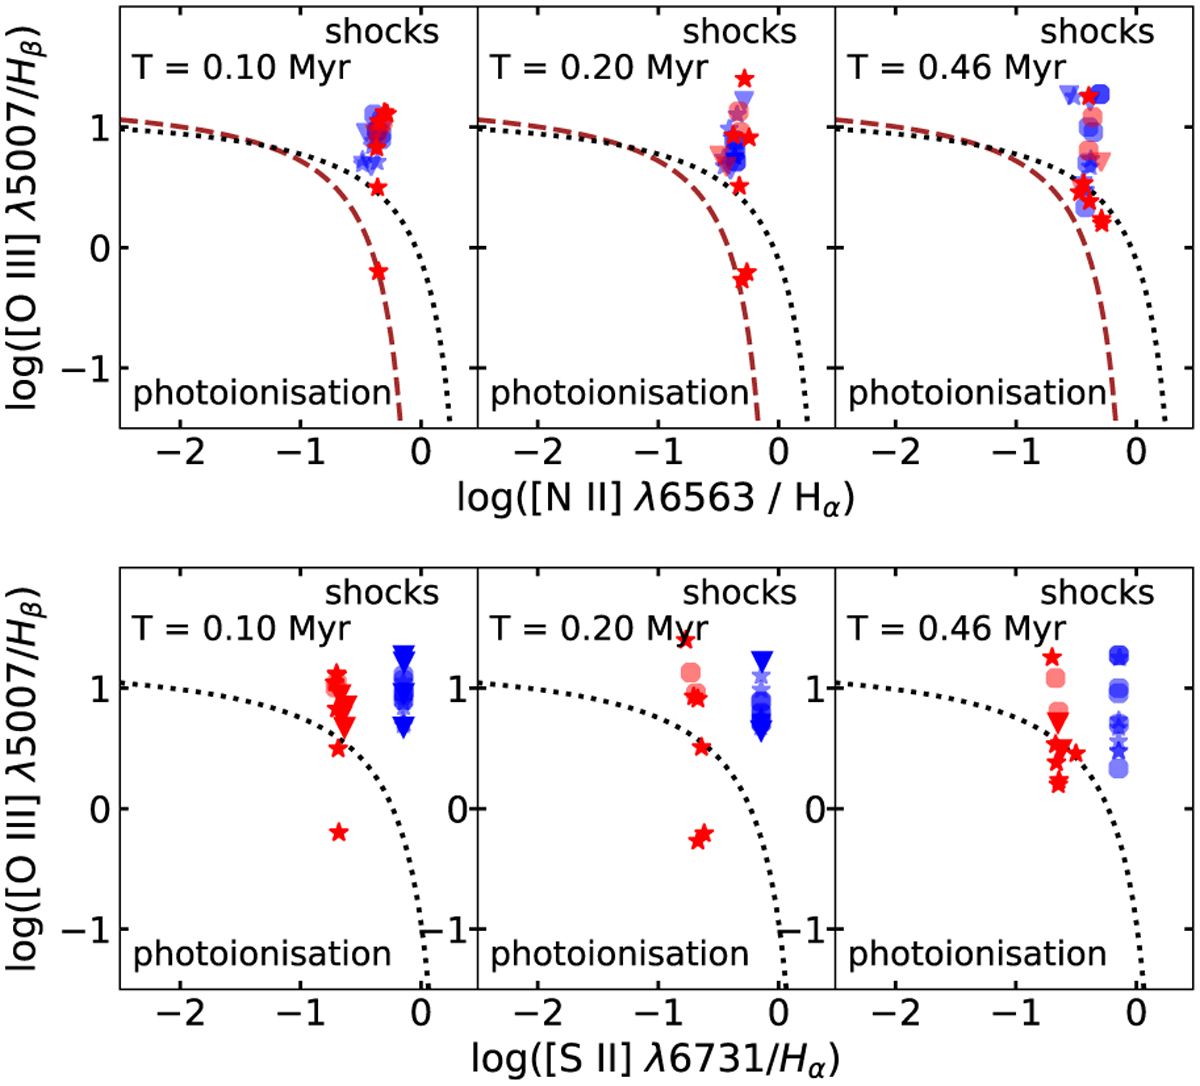
Fig. 6
Download original image
Time evolution (from left to right) of the classical BPT diagram (upper row) and sulphur BPT diagram (lower row) for ‘MHD25’, ‘HD25’ (blue) and ‘MHD50’, ‘HD50’ (red). Star symbols show MHD simulations and circle symbols show HD simulations. The dotted reference line is Kewley et al. (2001), and the dashed line is from Kauffmann et al. (2003) for the upper row. The dotted reference line for the lower row is from Kewley et al. (2001). For both figures, reference lines separate the photoionisation region (star-forming, lower left corner) and the shock-dominated region (upper right corner). The SNRs in the upper figure are typically located in the “mixed region” (between the reference lines) or in the region of shocks as collisions are the main excitation mechanism for strong optical lines. For the lower figure, SNRs are typically located in the shocks region. The sulphur BPT diagram can classify SNRs according to the different ambient densities (‘MHD25’+‘HD25’ vs. ‘MHD50’+‘HD50’), as was shown with k-means.
Current usage metrics show cumulative count of Article Views (full-text article views including HTML views, PDF and ePub downloads, according to the available data) and Abstracts Views on Vision4Press platform.
Data correspond to usage on the plateform after 2015. The current usage metrics is available 48-96 hours after online publication and is updated daily on week days.
Initial download of the metrics may take a while.